
Market Review Q1 2025 | Market Review Q2 2025 | Market Review Q3 2025 | Market Review Q4 2025 | Market Review Q1 2026 | Market Review Q1 2026
Third Quarter 2026
Midterms in Focus
The midterm elections are fast approaching, and many of us will surely be relieved when the barrage of political TV commercials, emails and text messages subsides. While the result of the elections could influence the direction of future policy, the immediate economic and market implications may be more limited. Key policy issues may include a congressional vote on the U.S. military engagement with Iran, tariff policy, tax policy, and AI risk and regulation.
For now, however, the U.S. economy has continued to perform well despite these policy uncertainties and a volatile geopolitical backdrop.
Economic Strength Defies Obstacles
The U.S. economy demonstrated resilience in the face of many hurdles during the third quarter, most notably a renewed increase in energy prices and inflation, continued military conflict with Iran, heightened trade tensions with Canada, and a significant selloff in the bond market.
Although oil prices briefly eased early in the third quarter as hopes grew for a resolution to the conflict, the lack of concrete progress meant that the blockade in the Strait of Hormuz continued to constrain global supply. Further complicating matters, an alternative method of transporting oil through pipelines from Saudi Arabia was impaired by an Iranian missile strike, adding to the supply disruption.
Despite these pressures, economic growth remained positive. The final read on second-quarter GDP showed growth of 2.2%, a modest decrease from the first quarter’s 2.5% growth rate. Nonresidential investment rose 8.5% as the AI buildout accelerated. Estimates for third-quarter GDP are wide-ranging, from the Conference Board’s estimate of 2.1% to the Atlanta Fed’s estimate of 3.7%. Growth could slow if consumer budgets become more constrained by higher prices and elevated interest costs on personal debt. At the same time, continued investment in AI and data-center infrastructure could provide a counterweight to softer consumer spending.
Inflation remained sticky, with most measures still at elevated levels. In the second quarter, PCE (personal consumption expenditures) inflation fell from May’s reading of 3.8% to 3.4%, but remained well above the Fed’s 2% inflation target. The Manufacturing Purchasing Managers' Index (PMI) increased during the quarter, with many respondents citing price pressures stemming from tariffs on imported supplies, higher oil prices, and supply disruptions. With diesel prices at record highs, inflation may remain elevated, putting further pressure on consumers and businesses.
The labor market appears to be roughly balanced, with fewer jobs available for a smaller pool of job seekers. Demographic trends are contributing to this dynamic, with more baby boomers retiring and fewer immigrant workers. Concerns about a deterioration in hiring and an uptick in layoffs due to AI adoption have not yet materialized to the extent some had anticipated.
The unemployment rate for September was 4.2%, down from the 2026 high of 4.5% in February, but up from the prior month’s 4.1%. Notably, wage growth declined to 3.0% in September, marking the lowest level since May 2021 and falling below the rate of inflation, indicating that wages are not keeping pace with rising costs. Nonfarm payrolls grew by 29,000 in September, while the August level was revised down to 133,000, indicating continued weakness in job growth.
Persistent inflation is increasing pressure on the Fed to keep price increases from becoming more entrenched. The relative stability of the labor market gives the Fed latitude to tackle inflation through its interest rate policy. In September, the Fed increased the federal funds rate by 25 basis points to 3.75% to 4.00%. CME data indicates markets expect one more 25-basis-point increase this year, likely at the December meeting, followed by another 50 basis points of increases by July 2027.
Corporate Earnings Led by Energy
The Energy sector led corporate earnings growth in the second quarter, with year-over-year earnings growth of 146.3%, highlighting the extent to which energy companies have benefited from the surge in oil and gas prices. The other leading sectors included Communication Services (116.9%), Consumer Discretionary (92.6%) and Information Technology (76.2%).
Overall, 86% of companies exceeded earnings-per-share (EPS) estimates, while 62% of companies issued positive EPS guidance for the year. According to the most recent FactSet earnings outlook, the S&P 500 is expected to report year-over-year earnings growth of 29.1% and revenue growth of 12.1% for the third quarter. As with last quarter, the sectors expected to lead earnings growth include Energy, Information Technology, Materials and Communications Services.
Equity Returns Hit the September Sag
Equity markets often experience volatility in the months leading up to a midterm election. September has also historically been a weaker month for markets, a phenomenon known as the “September Effect." Against that historical backdrop, U.S. equity markets posted mixed returns during the third quarter.
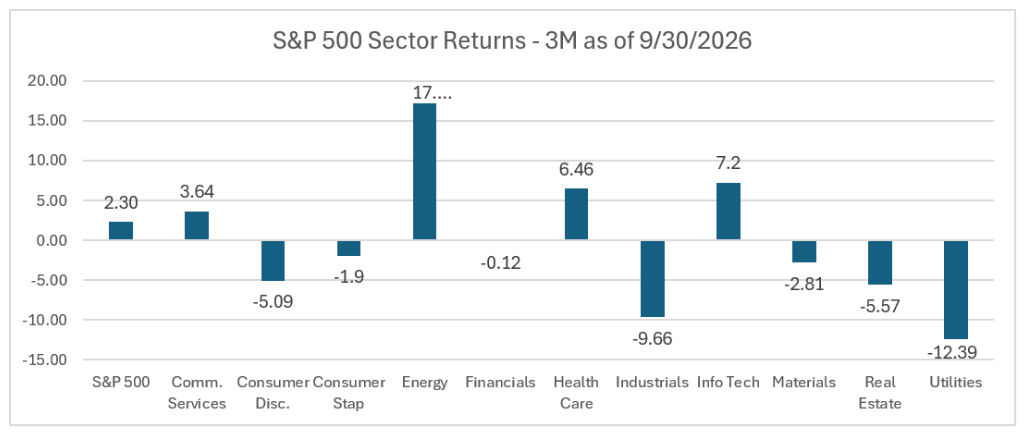
The S&P 500 fell 0.35% in September while posting 2.30% growth for the quarter, bringing its year-to-date return to 12.75%. Market leadership remained relatively narrow, with the equal-weighted S&P 500 Index posting a negative quarterly return and underperforming the traditional market-cap-weighted index by 426 basis points.
AI remained an important market theme, with companies continuing to invest heavily in data centers and other infrastructure. At the same time, questions around financing, infrastructure constraints, regulation and responsibility for AI-related risks continued to emerge. For now, policymakers and industry leaders appear focused on balancing these risks with the desire to maintain U.S. competitiveness in the global AI race.
The Nasdaq-100 Index, led by the AI trade, gained 2.61% in the quarter and 16.09% year to date. By contrast, weakness in financials and industrials weighed down the Dow Jones Industrial Average, which declined 2.34% for the quarter but remained up 7.19% year to date.
Source: Morningstar Direct
Bonds Give and They Take
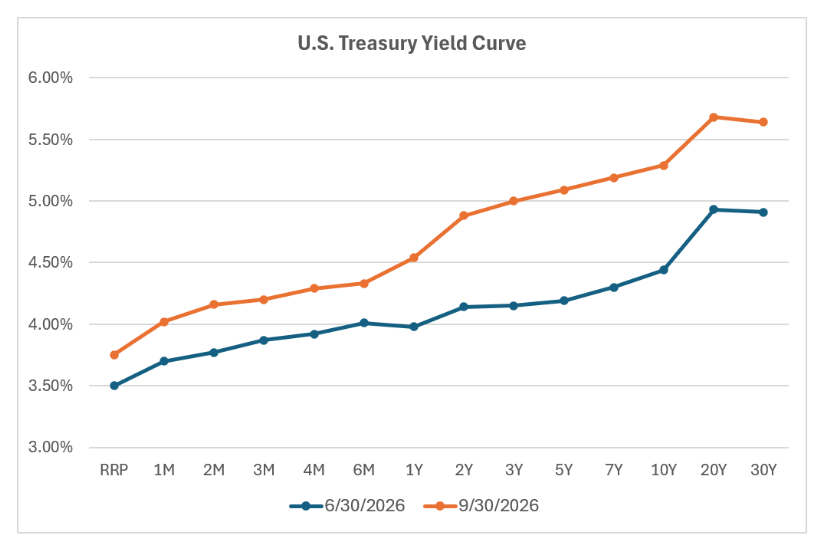
As discussed in our Bond Market Update, “boring bonds” are definitely grabbing investors’ attention and creating a degree of concern. Since that update, yields have moved up by approximately another 25 basis points. Multiple factors have pushed yields higher, including elevated oil prices, growing government debt in the U.S. and abroad, and continued economic strength. Heavy issuance of higher-yielding corporate debt to finance AI-related growth has also increased competition for investor dollars.
As of September 30, both the U.S. 10-year and 30-year Treasuries were at their highest levels since 2002, at 5.27% and 5.62%, respectively. During the quarter, the 10-year Treasury yield increased by 85 basis points. Because many borrowing rates are influenced by the 10-year Treasury yield, higher Treasury rates can translate into more expensive financing for consumers and businesses. The 30-year fixed mortgage rate hit its highest level in the last four years at 7.28% by quarter-end.
Source: U.S. Treasury Yield Curve.com
While higher yields can be welcome for investors, particularly when those yields can be locked in through individual bonds, they also come at a cost as bond values decline. Year to date, the Bloomberg U.S. Aggregate Bond Index was down 2.91%.
It remains unclear how long this rate environment will persist or whether rates will move meaningfully higher from here. Although bond yields increased following the inflation spike after the pandemic, today’s yields are now at levels investors have not experienced in nearly two decades. This is creating income opportunities within fixed income that have been much harder to find in recent years.
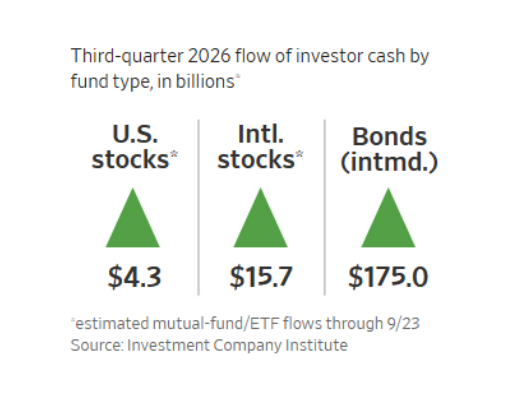
As shown in the chart below, investors took advantage of higher yields during the third quarter, directing significantly more money into bond funds than stock funds.
Source: Investment Company Institute
Looking Ahead
We understand that continued geopolitical uncertainty, higher interest rates and the upcoming midterm elections may leave investors wondering what comes next. The unknown can be uncomfortable, but history reminds us that markets have navigated many periods of economic, political and geopolitical uncertainty over time.
Maintaining a diversified portfolio aligned with your goals, time horizon, and risk tolerance can help keep short-term developments in perspective. As always, we are grateful for the opportunity to help guide you on that path.
Nancy Taylor, CFA, CFP, CAIA®
Senior Investment Officer
On behalf of the Cape Cod 5 Trust and Asset Management Investment Team
Rachael Aiken, CFP®, Chief Wealth Management Officer
Michael S. Kiceluk, CFA, Chief Investment Officer
Brad C. Francis, CFA, Director of Research
Jonathan J. Kelly, CFP®, CPA, Senior Investment Officer, Manager, Financial Planning
Benjamin M. Wigren, Senior Investment Officer
Craig J. Oliveira, CFA, Senior Investment Officer
Jack Dailey, Investment Analyst
Alecia N. Wright, Investment Analyst
Footnotes
Source: UBS Election Watch 2026: Investment insights on the US midterm elections | UBS United States of America
Source: WSJ https://www.wsj.com/finance/investing/stock-funds-q3-2026-ebcfc5c8
These facts and opinions are provided by the Cape Cod 5 Trust and Asset Management Department. The information presented has been compiled from sources believed to be reliable and accurate, but we do not warrant its accuracy or completeness and will not be liable for any loss or damage caused by reliance thereon. Investments are NOT A DEPOSIT, NOT FDIC INSURED, NOT INSURED BY ANY FEDERAL GOVERNMENT AGENCY, NOT GUARANTEED BY THE FINANCIAL INSTITUTION AND MAY GO DOWN IN VALUE.
