Market Review Q1 2025 | Market Review Q2 2025 | Market Review Q3 2025 | Market Review Q4 2025 | Market Review Q1 2026
Second Quarter 2026
Blast Off
“Space, the final frontier.” Those of us of a certain age may remember sitting in front of a black and white TV watching Star Trek. What once seemed like science fiction is quickly becoming reality with the recent IPO of SpaceX, the largest IPO in U.S. history, raising $75 billion. For investors, both young and old, this event will likely be memorable due to the impact it may have on major indices. SpaceX is scheduled to join the Russell 1000 Index on June 26, the Nasdaq 100 Index on July 7, and could potentially be added to the S&P 500 in 2027, launching investor portfolios to new stratospheres.
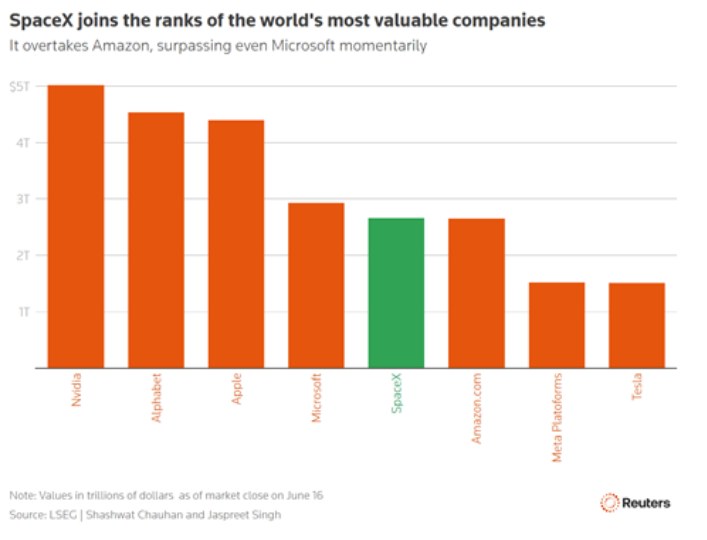
Source: LSEG | Shashwat Chauhan and Jaspreet Sign, Reuters
“To infinity and beyond!” Another iconic quote, this one from Toy Story, aptly sums up the second quarter’s sharp market rebound, and not only the excitement surrounding the SpaceX IPO. Equity markets propelled higher in the second quarter, led by the Technology sector, which saw a 31.6% increase. Semiconductor and semiconductor equipment companies outperformed, as the AI trade gained momentum again after cooling in the latter months of 2025. The war trade benefited defense companies, while policy changes associated with the One Big Beautiful Bill contributed to a renewed interest in manufacturing, supporting the Industrials sector, which posted a 14.5% return. Other sectors that had solid performance in the quarter included Financials, Healthcare and Communication Services. Meanwhile, oil prices declined significantly by quarter-end following the U.S. and Iran entering a Memorandum of Understanding and expectations that oil transport would soon normalize. As a result, the Energy sector posted a 14% decline, making it the worst performing sector in the S&P 500 Index. Overall, the S&P 500 Index increased 15.2% in the quarter, while the Nasdaq Index rose 26.1%, and the DJIA advanced 15.7%.
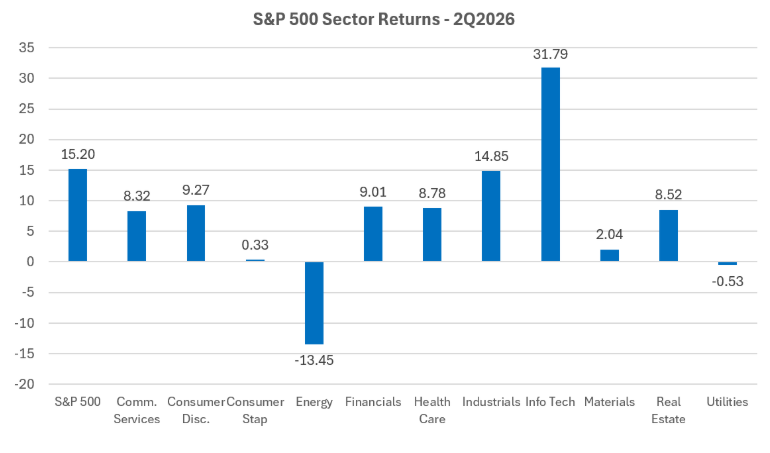
Source: S&P 500 data as of June 30, 2026
Small Cap stocks had their best first half since 1991, posting a 21% return reflected in the Russell 2000 Index.
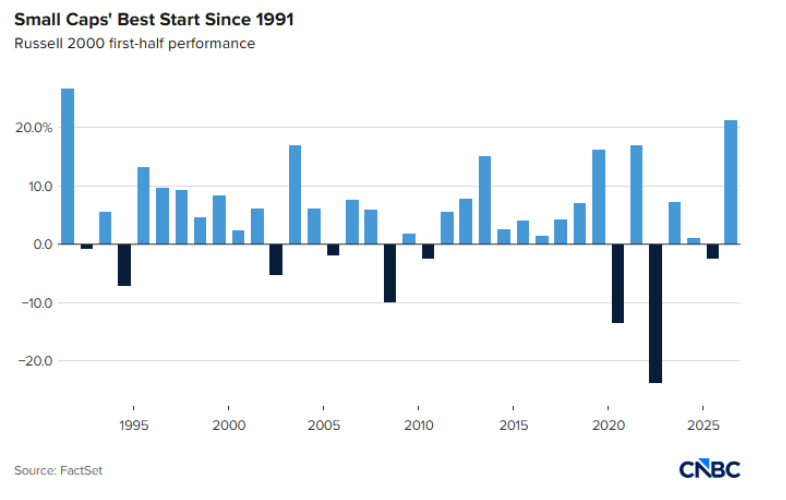
Source: FactSet
International equity markets also had a robust performance, with emerging markets leading the way. The IEFA MSCI Developed Markets Index rose 10.14% in the quarter, while the IEMG MSCI Emerging Markets Index rose 23.1%. South Korean companies benefited from the semiconductor and chip trade and the Kospi Index posted a stratospheric 60.6% increase in the quarter, despite the retraction in June.
Earnings - Rocket Fuel for the Markets
First quarter earnings grew a stellar 26.9% year over year, significantly exceeding the 12.1% growth that analysts had projected at the beginning of earnings season. This stronger-than-expected growth provided the fundamental support for stocks to move higher. Investments in AI infrastructure spending and enterprise solutions continued to drive revenue and margin growth in the mega-tech names. For the broader Index constituents, continued strength in the overall economy created a solid base for earnings growth, albeit at a much smaller scale than that experienced by tech-related companies.
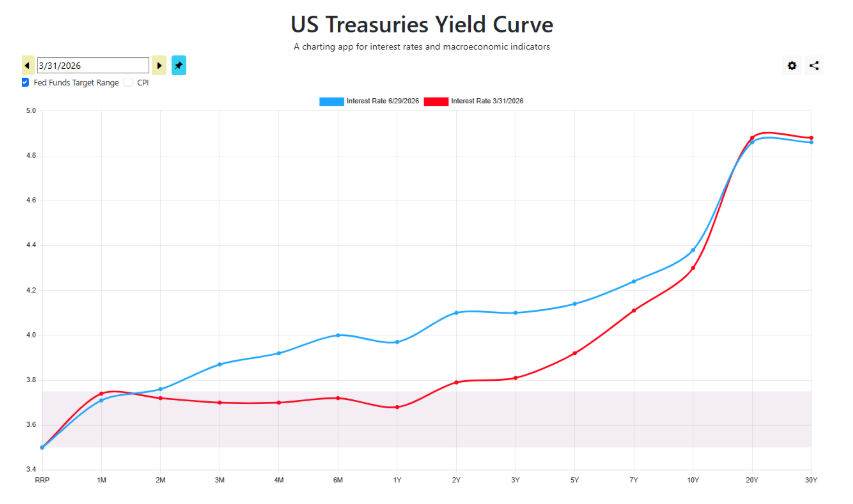
Bond markets were unsettled as conflict in the Middle East dragged despite a stated ceasefire, and a spike in oil prices reignited inflation concerns, resulting in higher interest rates across the yield curve.
Inflation data reinforced the view that price pressures were reaccelerating. Looking at Headline PCE, which includes volatile energy and food prices, the May reading was 4.10%, its highest level since April 2023. Core PCE, the Fed’s preferred inflation measure, rose 3.40% year over year in May following April’s 3.30% increase, marking its highest level since October 2023 at 3.48%. This data suggested that inflation was moving further away from the Fed’s 2% target, a challenging development for the bond market.
As a result, fixed income markets saw a meaningful shift in yields across much of the curve. The 2-year Treasury yield increased 35 basis points to 4.14%, while yields on 10-year Treasuries increased 14 basis points to end the quarter at 4.44%. On the short end of the curve, expectations of a reduction in the Fed Funds rate this year evaporated, and markets are now pricing in at least one 25 basis point increase by year-end.
Credit spreads, the additional compensation investors demand for taking credit risk, remain tight at about 77 bps, as measured by the BofA U.S. Corporate Index option-adjusted spread (OAS). These narrow spreads indicate market participants are confident in the U.S. economy and the quality of corporate debt given the low default rates in recent years.
Source: US Treasury Yield Curve, data as of 6/29/26
Charting A New Course
The new Fed Chairman, Kevin Warsh, set a fresh tone for Fed communications at his first meeting in June. Providing a shorter statement that lacked forward guidance, he struck a relatively hawkish tone, noting that “persistent high prices are a burden” and the Committee intends to take any necessary measures to ensure warming inflation does not shoot higher. While the monetary policy setting mechanisms will remain in place, Warsh intends to implement many changes, with five new task forces targeting different aspects of the FOMC’s operations. These task forces will deal with Communications, Balance Sheet Policy, Data Sources, Productivity and Jobs, and Inflation Frameworks.
In the Alternatives space, Gold has lost some of its luster as higher interest rates make holding the precious metal less attractive as compared to interest-bearing Treasuries. Gold fell 10.8% in the quarter, putting its 1-year return at 22%. Other metals, such as Silver, saw similar declines in the quarter. Private credit vehicles continue to make headlines as investment vehicles in this space grapple with greater withdrawal demand than the typical 5% per quarter liquidity gates can handle.
Reaching New Horizons
As we celebrate the 250th Anniversary of the birth of our nation, we are reminded that long-term progress is built by successfully navigating periods of uncertainty and change. Regardless of the market environment, our commitment remains the same: helping you pursue your long-term financial goals through thoughtful, disciplined investment management.
Thank you for your continued confidence and for entrusting us with the management of your assets. We sincerely appreciate the opportunity to serve you.
Nancy Taylor, CFA, CAIA®
Senior Investment Officer
On behalf of the Cape Cod 5 Trust and Asset Management Investment Team
Rachael Aiken, CFP®, Chief Wealth Management Officer
Michael S. Kiceluk, CFA, Chief Investment Officer
Brad C. Francis, CFA, Director of Research
Jonathan J. Kelly, CFP®, CPA, Senior Investment Officer, Manager, Financial Planning
Benjamin M. Wigren, Senior Investment Officer
Craig J. Oliveira, CFA, Senior Investment Officer
Jack Dailey, Investment Analyst
Alecia N. Wright, Investment Analyst
These facts and opinions are provided by the Cape Cod 5 Trust and Asset Management Department. The information presented has been compiled from sources believed to be reliable and accurate, but we do not warrant its accuracy or completeness and will not be liable for any loss or damage caused by reliance thereon. Investments are NOT A DEPOSIT, NOT FDIC INSURED, NOT INSURED BY ANY FEDERAL GOVERNMENT AGENCY, NOT GUARANTEED BY THE FINANCIAL INSTITUTION AND MAY GO DOWN IN VALUE.
