Market Review Q1 2018 | Market Review Q3 2018 | Market Review Q4 2018 | Market Review Q1 2019
Market Review - Second Quarter 2018
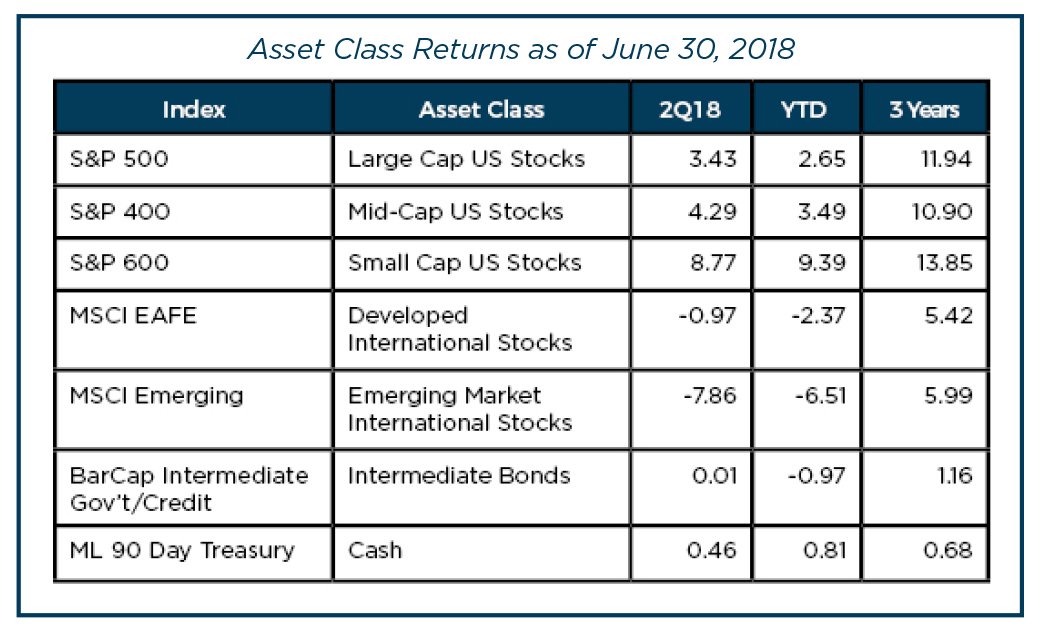
The stock market experienced a turbulent second quarter as investors grappled with escalating trade tensions, political uncertainty in the Eurozone and signs of slowdown in the global economy. In reaction, many market participants eschewed blue chip industrials and increased their exposure to large cap technology companies, further inflating the largest sector in the S&P. The tech-heavy NASDAQ rose 6.33% for the quarter, whereas the S&P 500 and Dow Jones Industrial Average had more modest gains of 3.43% and 1.26% respectively. While the NASDAQ hit a series of all-time highs in June and marked its eighth consecutive quarter of gains, the S&P 500 and Dow Jones remain well short of their January peaks.
Economy
Labor strikes in Germany and France in recent months and a cold-weather front across Northern Europe contributed to business activity in the Eurozone falling to its lowest level in a year and a half. Threats of increasingly restrictive trade policy have increased uncertainty around global economic forecasts.
Fears over a trade war were inflamed on May 31st when the Trump administration levied tariffs on steel and aluminum imports from Canada, Mexico and the EU. All countries affected detailed retaliatory tariffs on goods, such as U.S. food and agricultural products. Tariffs can create trade distortions and lower business confidence, increasing uncertainty for multinational companies.
Amidst global uncertainty, the U.S. looks relatively robust. Jobs continue to be added at a healthy pace, with 213,000 jobs added in June. The unemployment rate at 4% is near the lowest rate since April 2000. As expected, the Federal Reserve increased the federal funds rate by 0.25% to a range of 1.75% to 2.00% in June. The Fed also signaled the likelihood of two more increases before year-end as the U.S. economy is performing well and growing increasingly independent of the accommodative interest rates that were implemented to stimulate growth in the wake of the financial crisis.
Stocks
Although only 19 companies in the S&P 500 have reported quarterly results as of the end of June, early earnings estimates appear optimistic. Analysts have raised their Q2 bottom-up EPS estimate (an aggregate of the median EPS estimates for all index constituents) by 0.8%. In comparison, bottom-up EPS estimates typically decline during a quarter. Over the past five years, the bottom-up EPS estimate has had an average quarterly decline of 3.4%, suggesting that analysts may be too optimistic.
During the quarter, technology stocks were mostly insulated from tariff-related volatility. Industrial stocks, however, were hit disproportionately hard. The technology sector’s strong quarterly performance warrants some concern as overall market returns become more dependent on the performance of the largest sector by market-cap.
Standard and Poor’s (owners of the S&P 500 index) announced a significant change in their sector methodology, creating a new “Communications Services” sector to go into effect later this year. This new sector will materially affect Technology, Telecommunications and Consumer Discretionary sectors as key companies such as Google, Facebook, Comcast, Verizon, Netflix and AT&T will transition to the new sector.
The Investment team at Cape Cod 5 has been shadowing these changes since S&P’s announcement, assessing the implications. Clients will be well positioned in advance of S&P’s implementation of the change.
Fixed Income
The yield on the 10-year U.S. Treasury bond increased for the fourth consecutive quarter, reaching 3% before trade concerns and slowing global growth pushed investors to the relative safety of government debt and caused yields to decrease. Indicators of accelerating inflation, continued job gains for U.S. workers and anticipation of four rate hikes this year pushed the 10-year yield to a near seven-year high of 3.11% on May 17th. Yields ended the quarter at 2.85% as investors digested the threat rising trade tensions between the U.S. and its trade partners pose to global economic growth.
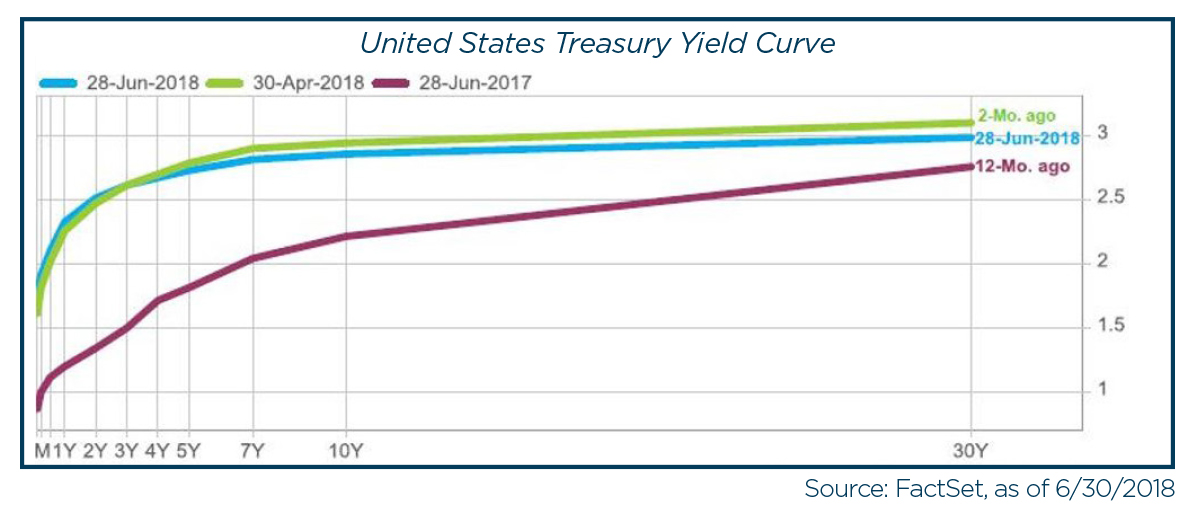
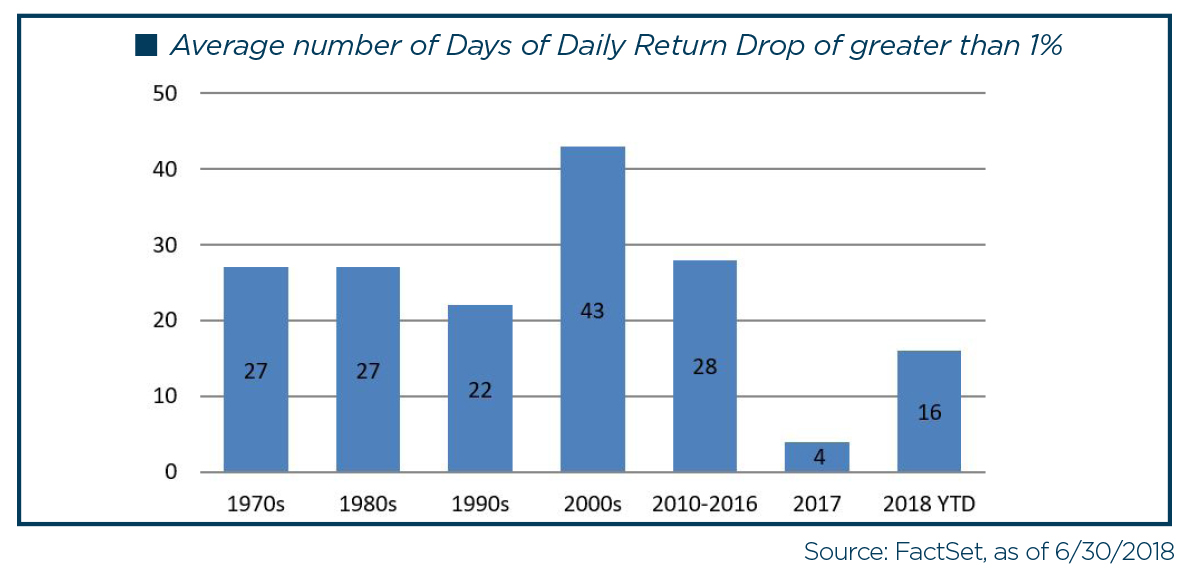
The spread between 2- and 10-year Treasuries this quarter was the narrowest it has been in more than a decade. Historically, an inverted yield curve (when short-term rates exceed long-term rates) has been a precursor for recessions, although lag time has varied considerably. The steady media coverage of geopolitics and trade frictions has kept market volatility elevated. The first half of 2018 experienced 16 days with S&P 500 declines of 1% or greater, compared to 4 days for all of 2017.
As we enter earnings season, the Investment Team continues to watch the yield curve, corporate earnings trends and outlook, along with macroeconomic reports and company-specific assessments in an effort to deftly navigate this year’s more turbulent market environment. We remain vigilant at the prospect of an inverted yield curve, but corporate earnings and macroeconomic reports remain relatively optimistic for market performance in the second half of the year. While the implementation of trade tariffs has injected uncertainty in the market, we believe this underscores the importance of following an appropriately designed investment strategy that incorporates a suitable asset allocation, diversification and portfolio rebalancing.
Michael S. Kiceluk, CFA, Chief Investment Officer
Brad Francis, CFA, Director of Research
Lee C. Gatewood, Senior Investment Officer
Kimberly K. Williams, Senior Wealth Management Officer
Robert D. Umbro, Senior Investment Officer
Jonathan J. Kelly, CPA, Senior Wealth Advisor
Craig Oliveira, Investment Officer
Christopher Chen, Investment Analyst
These facts and opinions are provided by the Cape Cod Five Trust and Asset Management Department. The information presented has been compiled from sources believed to be reliable and accurate, but we do not warrant its accuracy or completeness and will not be liable for any loss or damage caused by reliance thereon. Investments are NOT A DEPOSIT, NOT FDIC INSURED, NOT INSURED BY ANY FEDERAL GOVERNMENT AGENCY, NOT GUARANTEED BY THE FINANCIAL INSTITUTION, MAY GO DOWN IN VALUE.
