Market Review Q1 2019 | Market Review Q2 2019 | Market Review Q3 2019 | Market Review Q4 2019
Market Review Q1 2020
Market Review - Second Quarter 2020
First Half of 2020 Market Review: A Lot Can Happen in 90 Days
With so much happening, we feel a need to diverge from our typical quarterly review and reflect on the full first half of 2020. After more than a decade of consistent economic growth, stable interest rates, modest inflation, real wage growth and low market volatility, the U.S. economic expansion – the longest in the last 140 years – experienced a collapse in February. The world was facing a coronavirus storm and the U.S. was not immune.
The speed, reach and impact of the pandemic has been stunning. For some context, consider what can happen in 90 days:
- Based on data from the World Health Organization there were less than 200 cases of COVID-19 outside of China in early February (2/4/2020). By the beginning of May, 90 days later, three million people had been infected in more than 50 different countries worldwide.1
- February’s non-farm unemployment rate was 3.5%. 90 days later the unemployment rate was 13.3% according to the U.S. Bureau of Labor Statistics.2
- After 131 months of consecutive growth the ISM Manufacturing index posted a reading of 41.5 in April, signaling contraction. Ninety days later in June the reading was 52.6, signaling expansion.3
- The S&P 500 lost 19.6% in the first 90 days of 2020.4
- The S&P 500 gained 20.54% in the 90 days from April through June.5
- The nation’s money supply increased from $3.73 trillion on 3/11/20 to $5.23 trillion on 6/15/20, according to the Federal Reserve Bank of St. Louis.6
- The price of WTI oil dropped from $52.10 on February 14 to $11.26 on April 21, rebounding to $29.47 by May 15.7
- Over a 4-week period the Federal Reserve launched eight lending facilities, providing $2 trillion in loans.8
- The $2.3 trillion CARES Act was signed into law March 27, 2020.
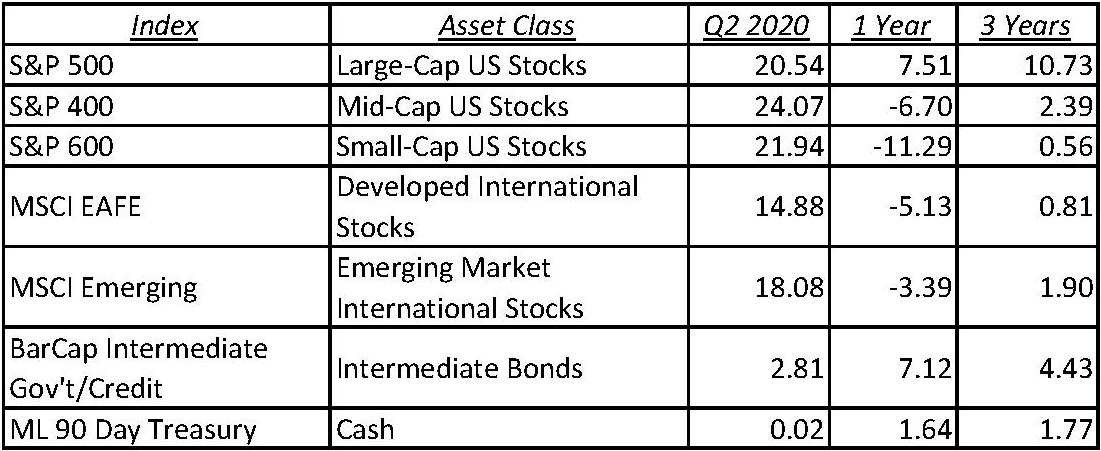
Asset Class Returns as of June 30, 2020
Economy
As the U.S. economy searches for solid ground, the June non-farm payroll report provided some welcome good news, posting 4.8 million jobs, well above estimates of 2.9–3.7 million. The surprise upside reduced the unemployment rate to 11.1%. Most of the hiring was in the retail, leisure and hospitality industries, some of the areas hit hardest by the effects of the pandemic. Average hourly earnings dropped by about $0.35 to $29.37 overall, reinforcing the return of hourly workers en masse. While debate swirls about how accurate readings have been, the trend is firmly in the right direction.
Initial jobless claims continue to drop, posting 13 straight weeks of lower highs. The last read before quarter-end was 1.482 million, approximately 3.5 times lower than all-time highs experienced in March.
The broader U6 unemployment rate, which includes persons marginally attached to the labor force and part-time workers who want full-time jobs, stands at 18%, down from 21.2% last month.
The ISM Manufacturing Index released July 1 posted a reading of 52.6, above the all-important 50 number – a reading that indicates expansion.
Consumer confidence closed the quarter with a much-improved reading of 98.1 (as of June 30), a three-month high. Home prices remain stable, trending higher. The Case-Shiller 20 city composite increased 1.1% year over year (as of June 30).
Consumer spending, which represents more than two-thirds of gross domestic product (GDP), powers the U.S. economy. The free market system requires a healthy symbiosis between supply and demand. Workers back on the job will go a long way to reestablishing a higher equilibrium.
Equities
Stocks had a very good quarter. U.S. large-cap stocks ceded performance leadership to mid- and small- cap stocks in the quarter. Growth stocks continued to outperform value stocks and the U.S. once again posted better results than international. The tech-heavy Nasdaq gained 30.6% in the second quarter.
S&P 500 YTD
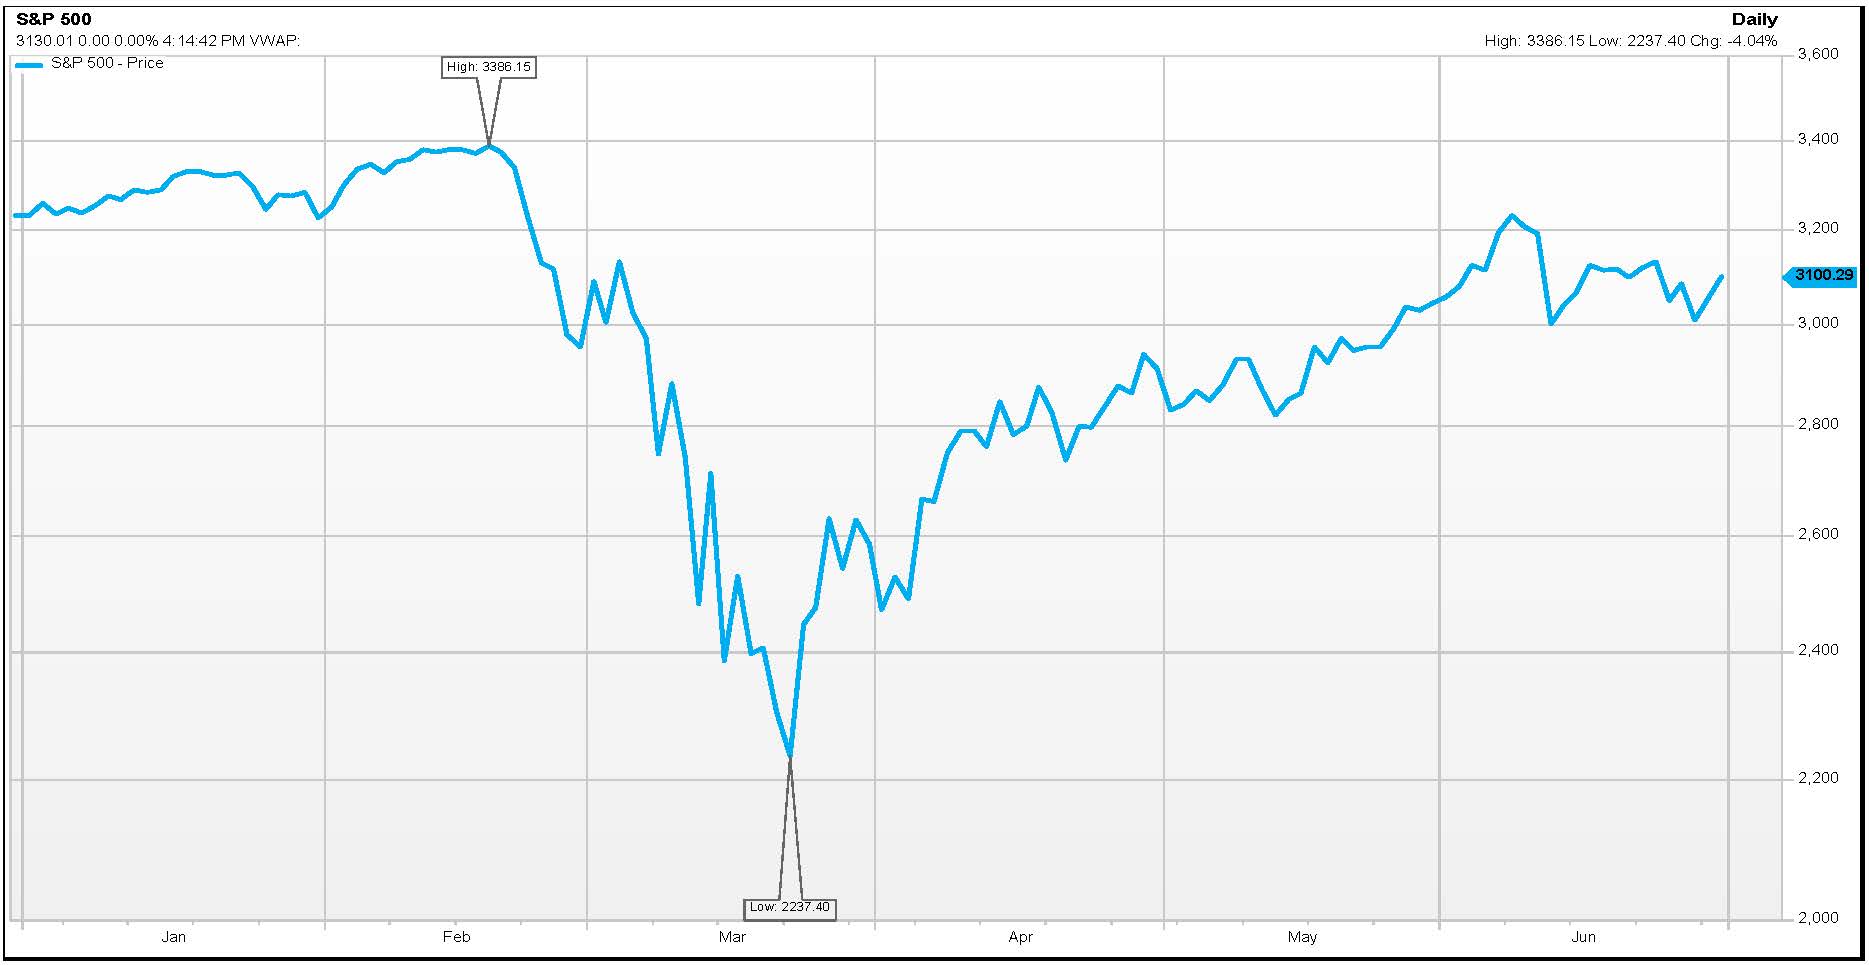
After posting the worst quarterly performance since 1938 in the first quarter, stocks rallied.
The S&P posted the best performance since 1998 and the best second quarter – ever!
Technology stocks, particularly the mega-cap companies, once again take top spot for the year. Year-to-date the technology sector is up 15.0%. Energy, the worst performer, returned -35.3% on a year-to-date basis. Of the 11 sectors in the S&P 500, Tech and Consumer Discretionary are the only two with positive YTD performance.
S&P 500 Sector Returns
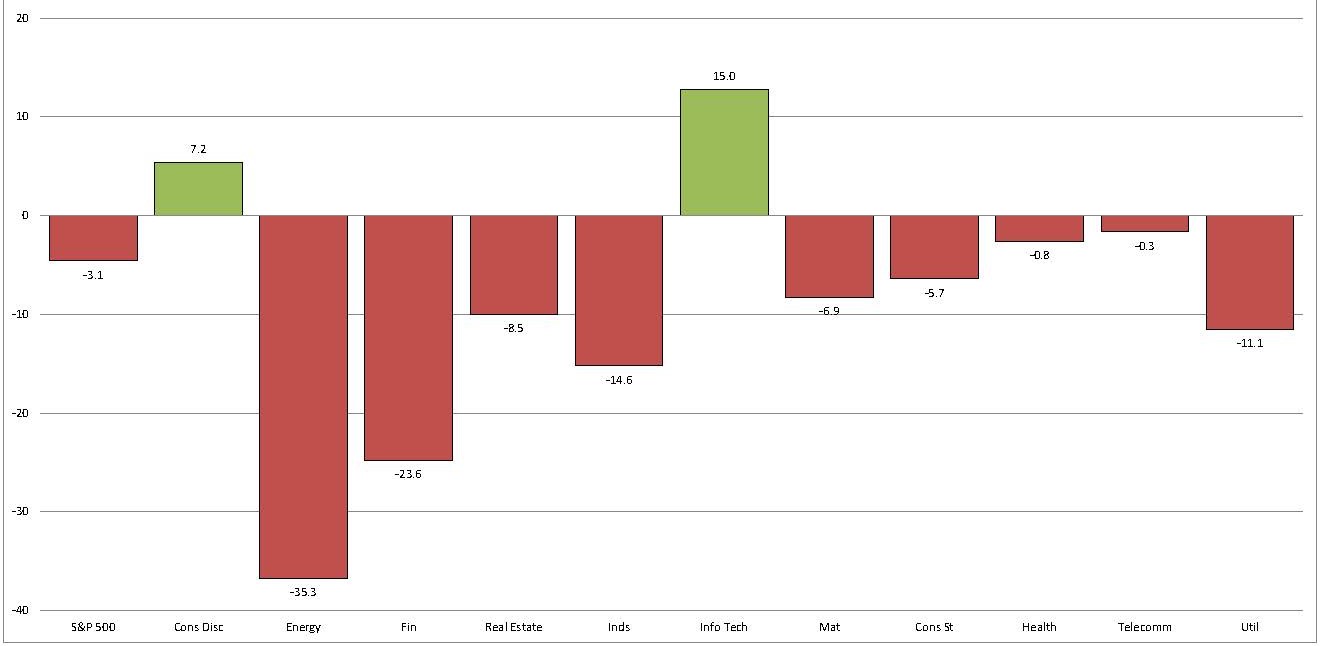
Of note, the top five companies in the S&P 500 (Microsoft, Apple, Amazon, Alphabet and Facebook) represent about 20% of the index.
Fixed Income
The long-term average 10 Year Treasury Rate has been 4.45%. The rate at quarter-end – 0.66%! This is down about 1.22% from the beginning of 2020. In early June the 10 Year got above 0.90% briefly before coming back down and ending the quarter close to where it started.
United States Treasury Yield Curve
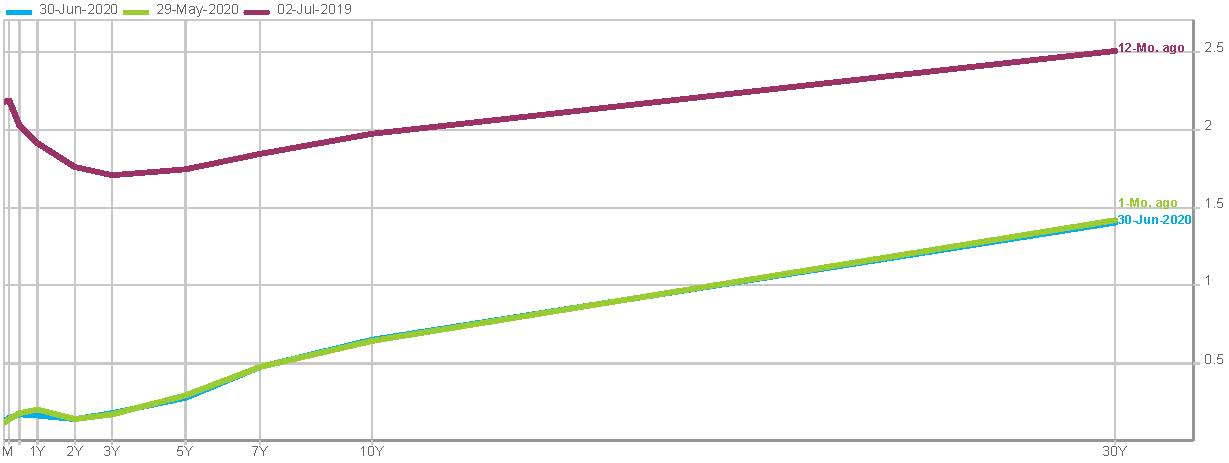
Source: FactSet Interest Rate Database
Municipal bonds had their best rally in a decade after the Fed announced plans for a Municipal Lending Facility, which was viewed as a “backstop” for municipal issuers and fueled demand for these bonds.
For some perspective outside the U.S. – Austria recently issued $2.3 billion Euro debt maturing in 100 years at 0.88%. Yes, a yield of less than 1.00% for 100 years. According to reports, the auction was oversubscribed by ten-fold.
Final Thoughts
The sheer instability we have felt in the first half of 2020 – from consumer confidence and employment to markets, trade and world economy to societal change and political tensions – makes assessing the path forward not just difficult, but frankly, impossible.
Much remains unresolved. We have an economy only beginning to reassert itself. A virus that keeps the world on a short leash and remains largely uncontained. Aggressive fiscal and monetary policy for which the efficacy and long-term costs are unclear. And, in the U.S., an election year.
Although the path forward is undefined, the opportunities are exciting. Businesses are transforming the way they interact with customers and stakeholders – digital adoption in financial services and telemedicine in healthcare are two examples. Environmental, Social and Governance (ESG) standards are becoming “must have” corporate attributes. In a word, sustainability is “in” and the long-term prospects are encouraging.
Michael S. Kiceluk, CFA, Chief Investment Officer
Brad C. Francis, CFA, Director of Research
Lee C. Gatewood, Senior Investment Officer
Jonathan J. Kelly, CFP®, CPA, Senior Investment Officer
Sean F. McLoughlin, CFP®,CIMA, Senior Investment Officer
Robert D. Umbro, Senior Investment Officer
Kimberly K. Williams, Senior Wealth Management Officer
Craig J. Oliveira, Investment Officer
Christopher E. Chen, CFA, Investment Analyst
1. World Health Organization, www.who.int (accessed July 9, 2020). • 2. U.S. Bureau of Labor Statistics, www.bls.gov (accessed July 9, 2020). • 3. Institute for Supply Management, www.institutionforsupplymanagement.org (accessed July 9, 2020). • 4. FactSet, www.factset.com (accessed July 9, 2020). • 5. FactSet, www.factset.com (accessed July 9, 2020). • 6. Federal Reserve Bank of St. Louis, www.stlouisfed.org (accessed July 9, 2020). • 7. Macrotrends, www.macrotrends.net (accessed July 9, 2020). • 8. Behind The Numbers, www.btnresearch.com (accessed July 9, 2020).
These facts and opinions are provided by the Cape Cod Five Trust and Asset Management Department. The information presented has been compiled from sources believed to be reliable and accurate, but we do not warrant its accuracy or completeness and will not be liable for any loss or damage caused by reliance thereon. Investments are NOT A DEPOSIT, NOT FDIC INSURED, NOT INSURED BY ANY FEDERAL GOVERNMENT AGENCY, NOT GUARANTEED BY THE FINANCIAL INSTITUTION AND MAY GO DOWN IN VALUE.
Contact our Wealth Team Coronavirus (COVID-19) Preparedness & Response
