Market Review Q1 2021 | Market Review Q2 2021 | Market Review Q3 2021 | Market Review Q4 2021
Market Review Q1 2022
Market Review
The first half of the year closed with global markets in decline, responding negatively to the macro backdrop of rising rates, insidious inflation and recession fears. Despite three attempts to rally in the second quarter, markets succumbed to selling pressures that accelerated in June, finally pushing the S&P 500 into bear market territory, defined as a fall of 20% or more from a recent high. No doubt it’s been a painful six months for investors, with both stocks and bonds coincidentally posting back-to-back quarterly declines. This has occurred only three other times over more than a 100-year span,1 leading to painful mid-year portfolio returns.
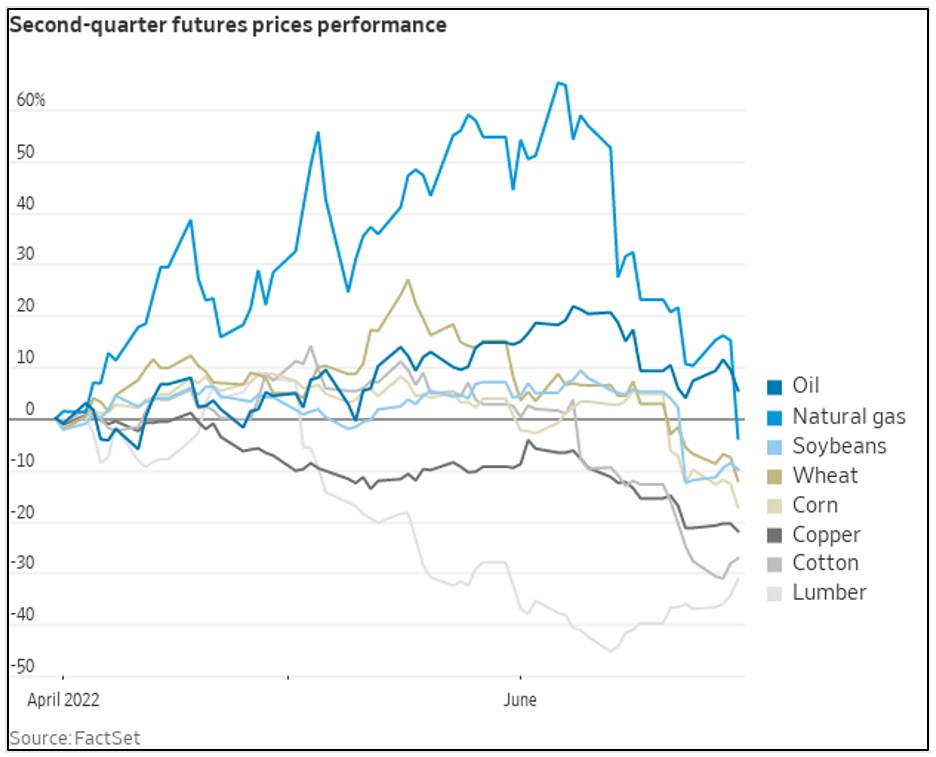
June’s losses were not confined only to equities and bonds; overall commodity prices also declined. The Bloomberg Commodity Total Return Index fell over 10% in June alone, as global growth fears and subsequent demand destruction pulled prices lower. For the quarter, the index declined 5.66%. June index level losses were widespread, ranging from energy to metals to agriculture. From record highs earlier in the quarter, natural gas tumbled 33.52% in June, closing with a 6.02% loss.2 On June 30, U.S. crude oil closed at $106 a barrel, well off its earlier highs of $120 a barrel. Wheat, corn and soybeans all cycled lower, ending the quarter cheaper than at the end of March.3
Risk aversion in the second quarter fueled the continued sell-off in cryptocurrency. The often-volatile asset class lost over $2 trillion in value this year, with Bitcoin declining 70% from its peak and Ethereum falling 80%.4
Inflation fears dominated much of the quarter, but there was growing optimism that inflation had already peaked, and future inflation readings would confirm it had in fact “rolled over.” Unfortunately, May’s hotter than expected headline Consumer Price Index (CPI) reading of 8.6% year-over-year and a whopping 1% month-over-month, represented a fresh cycle high. This important piece of data was a turning point for the central bank. Subsequent inflation data, such as the Dallas Trimmed Mean inflation gauge, which excludes the greatest data outliers and then calculates an average of the remaining, reinforced the underlying persistence and continued broadening of inflation pressures. The Fed acquiesced, acknowledging that fighting inflation was imperative, even if its efforts sacrificed economic growth. As a result, the Fed implemented an aggressive front-end loaded series of rate hikes aimed at reducing excess demand to rein in prices.
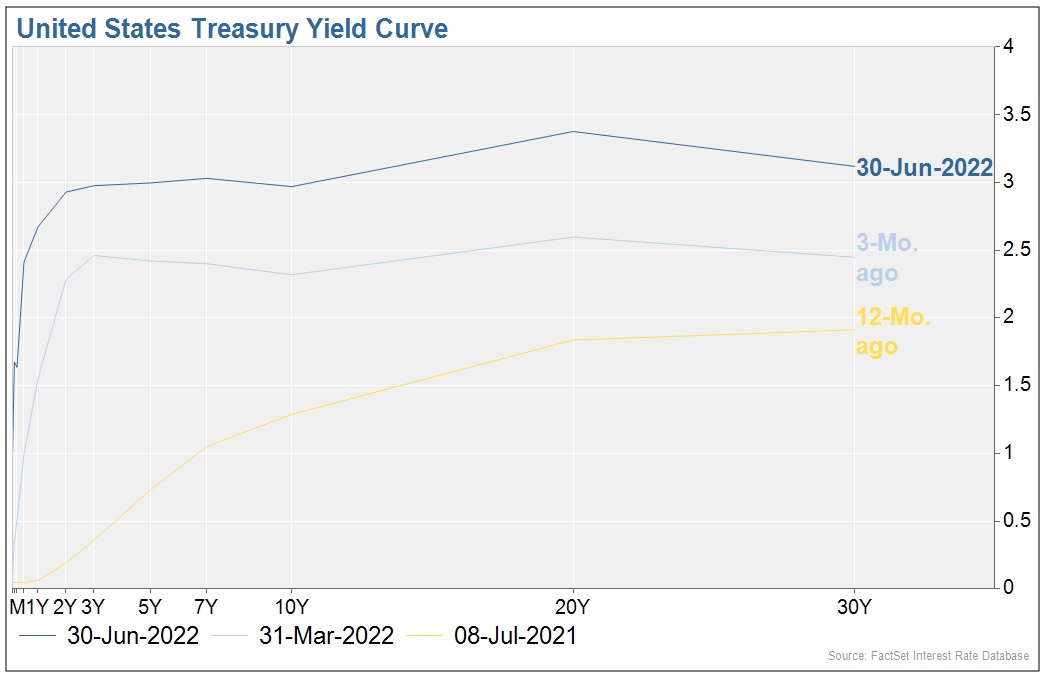
Market participants were quick to believe the Fed’s determination and priced in a significantly higher terminal rate for the Fed funds rate. At the same time, the economic implications of accelerating tighter financial conditions were questioned. By the close of the quarter, faced with slowing economic growth and the fear of a near term recession, investors sold economically-sensitive stocks and rotated into longer dated bonds resulting in the 10-year Treasury falling from a peak of 3.48% on June 14 to 3.01% on June 30.
Economy
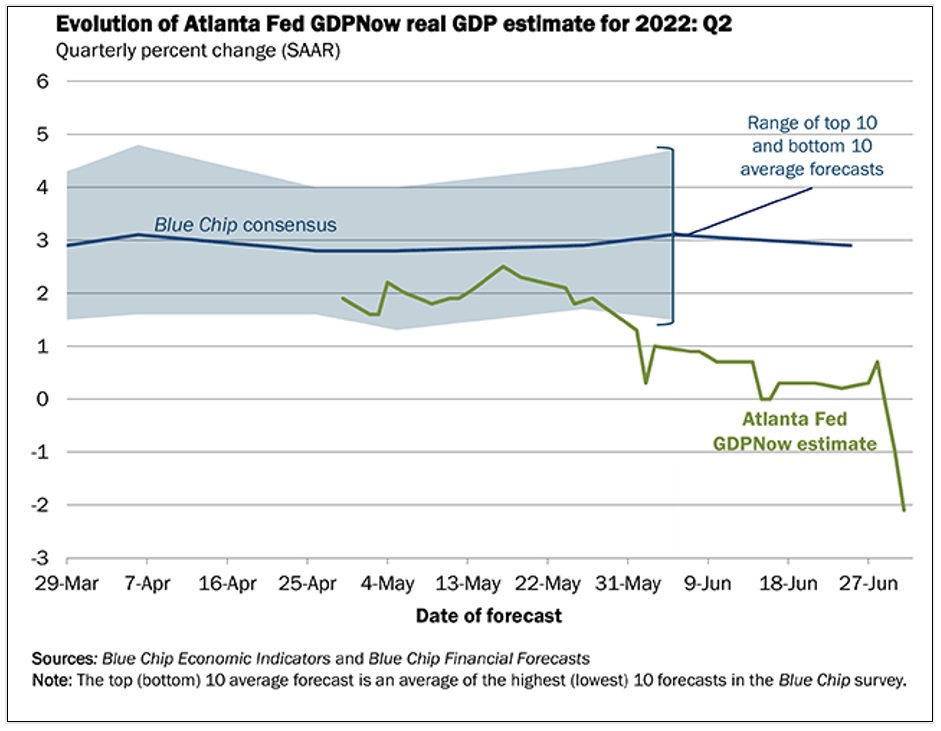
We close the first half of the year with the odds of a recession rising. As of June 30, the Atlanta Fed’s GDP Now model has aggressively downgraded second quarter economic activity, forecasting an annualized decline of 2.1% in GDP and fanning recessionary fears. This forecast builds on first quarter economic weakness, with the final Q1 GDP reflecting a -1.6% annualized decline in economic activity. A second consecutive negative quarterly real GDP reading would qualify for the textbook definition of a recession. According to the National Bureau of Economic Research, the official arbiters of recessions, a broader look at the duration and deterioration of economic conditions is warranted before any definitive recession declaration can be made.
In the interim, we lean into a series of leading economic indicators for early warning signals of weakness. The Conference Board’s LEI (Leading Economic Indicators) declined 0.4% year-over-year in April and May, resulting in a six-month moving average of -0.4% - evidence of a slowdown that bears watching. The Citi Economic Surprise Index looks at whether economic data is surprising to the upside (positive surprise) or to the downside (negative surprise). It ended the quarter around the worst level for the year – deeply in negative territory – adding additional evidence of an economic activity decline.
With consumption representing more than two-thirds of GDP, the attitudes and activity of the consumer often foreshadow the resiliency of our economy. The consumer sentiment leading indicators, whether measured by the Conference Board’s Confidence Expectations Index or the University of Michigan Consumer Sentiment Index, sit at decade lows. And, while anecdotally the consumer may say one thing and do another, May’s real personal spending declined for the first time this year, suggesting a slowdown in consumption may be around the corner.
While all of these leading indicators are flashing yellow, reflecting an economy that is slowing down, it is NOT grinding to a halt. The economy is responding to tighter financial conditions and moderating after exceptionally strong growth in 2021. It remains buoyed by a strong labor market, a healthy consumer and businesses with solid fundamentals, all supporting the argument that any near-term recession should be short and shallow.
Fixed Income
It’s been another challenging quarter in the bond market. Total returns across the fixed income universe were negatively impacted by the velocity of rate increases anticipated by the Fed, especially after their June meeting. The 2-year Treasury rose this quarter to 2.93% while the 10-year Treasury closed at 2.98% but rose to as high as 3.5% earlier in June. With the 2-year Treasury yield still lower than the 10-year Treasury yield, the yield curve flattened this quarter but avoided inverting. An inversion, where short-term rates exceed long-term rates, may portend a recession and investors will be watching for any prolonged periods where rates reflect this dislocation.
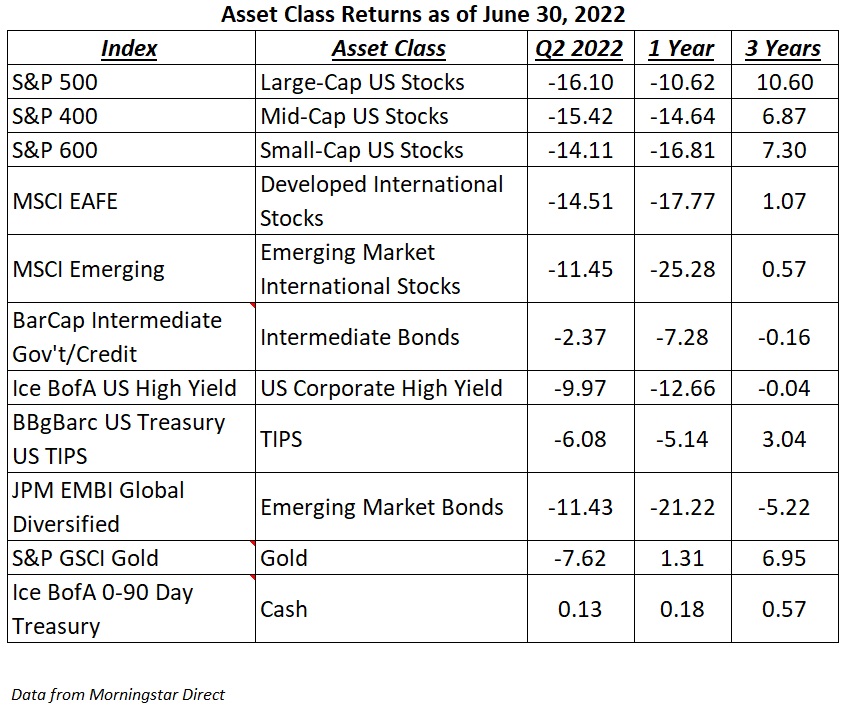
With rates climbing this quarter, prices continued to fall. The Bloomberg U.S. Aggregate Index, a broad-based benchmark that includes investment grade corporate bonds, treasuries and mortgage-backed securities, declined 4.69% for the quarter and 10.35% year to date. Credit sensitive areas such as U.S. high yield fell 9.97% in the second quarter and 14.04% so far this year. Spreads widened at the close of the quarter while recession fears mounted and future corporate profit growth concerns surfaced ahead of the Q2 earnings season. International bonds shared in the fixed income challenges. Emerging market debt, measured by the J.P. Morgan EM Bond Index, fell 11.43% for the quarter and 20.31% for the year, hurt by the strength of the US dollar, tighter financial conditions and inflation. Inflation-linked bonds, as measured by the ICE BofA Inflation-Linked Treasury Index, declined 6.73% for the quarter and 9.24%YTD: a victim of the longer-duration nature of the index being severely impacted by the rise in rates.
The silver lining is that a significant amount of pain has already been priced into the bond market. New higher yields can also offer a margin of safety, even if rates tick up a bit higher. The higher level of income could help to offset the decline in market value, offering a positive total return. In addition, the rise in yields not only provides a higher level of current income on investments marked to the market, i.e. money market rates, but higher coupon rates provide more attractive reinvestment opportunities.
In line with the narrative that the bond market has already priced in the majority of the Fed’s future tightening, this quarter at Cape Cod 5 we made the tactical decision to increase the duration and average maturity of our fixed income portfolios. This action enabled the capture of higher rate opportunities being offered in longer-dated maturities. At the same time, we acknowledged the economic risks of an aggressive Fed on the economy and corporate profits. These risks could weigh more heavily on credit-sensitive areas of the bond market. As a result, we also decided to reduce our exposure to lower credit quality areas, such as high-yield and emerging market debt, in favor of increasing our highest credit quality holdings of treasury and marketable FDIC Insured CD (Certificate of Deposit) holdings.
Equity
Equity markets accelerated earlier year declines, and by the end of Q2 all three major averages, DJIA, S&P500 and the NASDAQ, had corrected and two had crossed over into bear market territory.
The S&P 500 joined the NASDAQ and entered its 15th bear market on June 16, declining 23.55% from its January 3 high. The S&P 500 lost 8.25% in June – a total of 16.20% in the second quarter – bringing year to date losses to -19.96%. The decline is now reflected in the market multiple with the forward P/E ratio declining to 15.9X earnings below the S&P’s 25-year average of 16.8X. This change presented a market with a more reasonable and attractive valuation than the beginning of 2022. This repricing reflects the market’s digestion of rate increases and inflation concerns, and it has begun to price in an economic slowdown. To use a baseball analogy, we may be in the seventh inning stretch, as we anticipate continued volatility focused around corporate earnings this quarter. In light of the uncertain macro backdrop, we would have anticipated a significant downgrade to corporate profits from the analyst community. Yet, according to FactSet, as of June 30 the Q2 bottoms-up earnings estimate only decreased by 1.1%, reflecting a far more optimistic analyst community than in the past. Over the last 5-year period, FactSet reports the average decline has been 2.4% and ten-year average decline has been 4.7%. Of keen interest will be how earnings estimates compare against actual quarterly numbers, once the earnings season gets underway. Will earnings keep pace with the projected positive full-year earnings growth? Most market selloffs are usually some combination of weaker earnings and multiple compression. Company commentary will be of particular interest as reports are released.
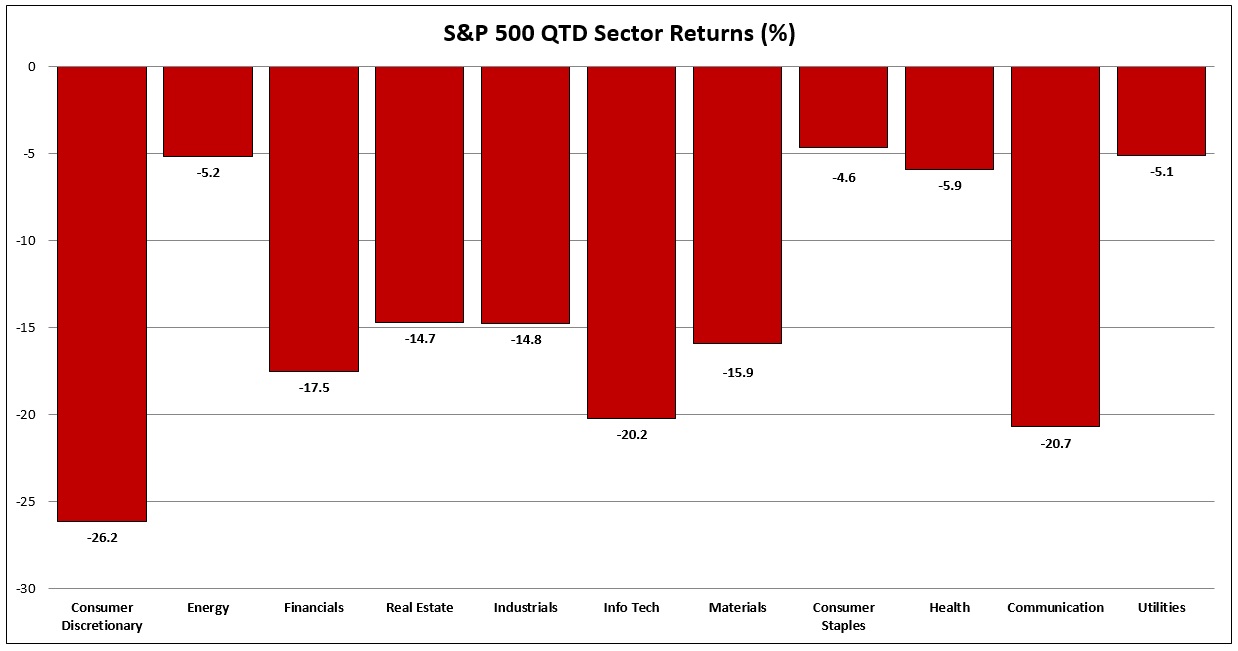
At the sector level, areas tethered to growth and the consumer, as well as significant exposure to international revenues, lurched lower. Three sectors declined more than 20%: consumer discretionary (-26.2%), technology (-20.2%) and communication services (-20.7%). Other more defensive sectors declined less: healthcare (-8.3%), consumer staples (-4.6%) and utilities (-5.1%). Even the energy sector declined 5.2% this quarter, but still provided a positive 31.8% year-to-date return.
Quarterly double-digit declines extended to the mid-cap and small-cap universe and extended internationally with the developed and emerging markets falling more than 10% in the second quarter.
Each rally this quarter provided us with an opportunity to sell positions into strength and reposition portfolios on predetermined divesture strategies. Declines that repriced many areas of the market allowed us to introduce quality companies into our portfolios, which now offer growth at a reasonable price.
Conclusion
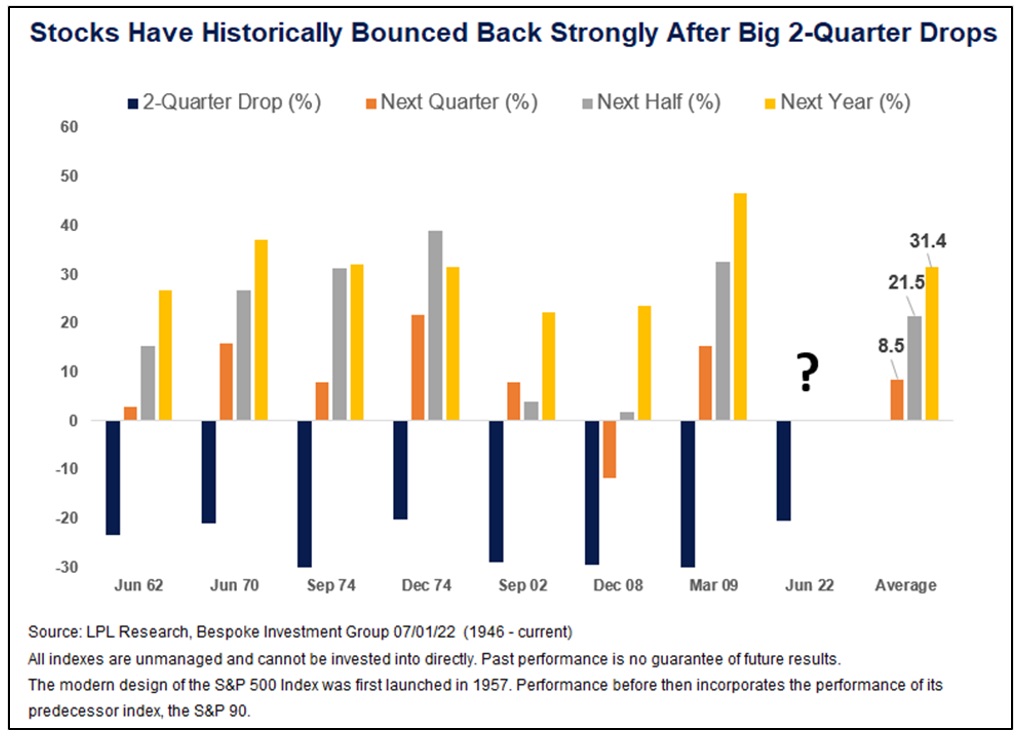
We recognize that it is much easier to stay invested when the market is making new highs than when it is struggling to find a bottom. LPL Research provides us with a historical perspective that focuses on market performance, following a two-quarter cumulative decline of 20% or more. The study finds that the average gain in the two quarters following has been 21.5% and 31.4% the next year. While this is no guarantee that the second half of this year will feature a rebound, it does give a historical precedent as a source for guarded optimism.5
The summer months will be anything but slow and easy for investors, as we anxiously await the July releases of June employment and inflation data. The second quarter earnings season is at hand and may provide important insights on the economy, inflation and the future health of corporate America’s earnings and profit margins. The Federal Open Market Committee meets for a two-day policy meeting in late July, where it is expected to raise rates again and offer commentary on the pace of rate hikes, path of inflation and the economy. As summer continues to unfold, we will be laser-focused on these reports and their impact on the markets and your portfolios.
The world has exhibited nothing but resilience over the last 30 months. These current times can seem unsettling, but a longer view over the horizon will bring more clarity. At Cape Cod 5, we remain vigilant, so hopefully your summer months can be slow and easy. Please take a moment to pause and enjoy! And as always, reach out to us at any time to discuss your specific circumstances or if you have any questions.
Thank you for the trust you place in Cape Cod 5. It is our privilege to serve you.
Rachael Aiken, CFP®
Senior Investment Officer
On behalf of Cape Cod 5 Trust and Asset Management Investment Committee
Michael S. Kiceluk, CFA, Chief Investment Officer
Brad C. Francis, CFA, Director of Research
Rachael Aiken, CFP®, Senior Investment Officer
Jonathan J. Kelly, CFP®, CPA, Senior Investment Officer
Benjamin M. Wigren, Senior Investment Officer
Kimberly Williams, Senior Wealth Management Officer
Robert D. Umbro, Senior Investment Officer
Craig J. Oliveira, Investment Officer
Alecia N. Wright, Investment Analyst
1 Wealth of Common Sense, Ben Carlson/Ritholtz Wealth Management, July 3, 2022
2 Eaton Vance Monthly Monitor, July 2022
3 Wall Street Journal, July 5, 2022
4 Wall Street Journal, July 2, 2022
5 LPL, Reasons for Optimism as Second Half Gets Underway, July 7, 2022
These facts and opinions are provided by the Cape Cod 5 Trust and Asset Management Department. The information presented has been compiled from sources believed to be reliable and accurate, but we do not warrant its accuracy or completeness and will not be liable for any loss or damage caused by reliance thereon. Investments are NOT A DEPOSIT, NOT FDIC INSURED, NOT INSURED BY ANY FEDERAL GOVERNMENT AGENCY, NOT GUARANTEED BY THE FINANCIAL INSTITUTION AND MAY GO DOWN IN VALUE.
Contact our Wealth Team More Market Insights from Cape Cod 5
