Market Review
Second Quarter 2023 – Mid Year Update
ECONOMY: Economic Resilience – Recession Delayed
With a wide array of leading indicators signaling recession for the better part of a year, the U.S. economy continues to defy recession calls. Despite an inverted yield curve for the last 12 months, seven straight months of contracting manufacturing activity, and 14 months of declining readings from the Conference Board’s Composite of Leading Economic indicators, current economic conditions signal resilience, thereby pushing out recession calls to late 2023, early 2024.
Looking in the rear-view mirror, first quarter GDP expanded more rapidly than initially expected, revised up to 2.0% from its initial 1.3% and building upon 2022’s fourth quarter GDP gain of 2.6%.
The Q1 advance is largely attributed to the strength of consumer spending which grew 4.2%. An additional tailwind was positive trade flow (exports greater than imports), and less drag from residential fixed investment (spending on housing).
A mosaic of economic data points – durable goods orders, business investment activity, new home sales, initial jobless claims and consumer sentiment – reveal continued positive economic momentum. Incorporating incoming data daily, the Atlanta Fed’s GDPNow economic forecasting model estimates 2.2% growth for the second quarter as of June 30, thus reducing the odds of a 2023 recession and adding fuel to a “soft landing” scenario where inflation continues to move lower without a significant rise in unemployment or contraction in economic growth. But a soft landing is by no means guaranteed as the economy continues to digest 500 basis point of rate hikes in the past 15 months.
Looking ahead, we will continue to watch the health of the consumer. Their ability and willingness to spend has kept the economy afloat and more than offset any weakness in manufacturing and housing thus far.
Labor market strength continues to support current consumption trends. Businesses continue to hire and job creation over the last 14 months has exceeded consensus estimates with nonfarm payrolls averaging 315K in April & May.
Although the May JOLTS report (Job Openings and Labor Turnover) data showed job openings fell from April, there are still 1.6 openings for every unemployed person, well above the pre-pandemic level of 1.2. This reinforces the assessment of a tight labor market. That report also highlighted total separations declining, indicating employers remain reluctant to part ways with employees. In addition, sentiment data supports a consumer willing to spend. June’s release of the University of Michigan’s survey of consumers shows a consumer more upbeat with respect to current and future economic conditions, with overall sentiment readings rising 9.0% in June and up 29.0% year over year.
Employment data will be key to watch. The June employment report will either reinforce past trends or provide an inflection point with respect to job creation, wage growth and the unemployment rate that will color investors’ assessment of the economy. Historically, a more than a 0.5% increase in the unemployment rate above its minimum in the prior 12 months has been a credible recession indicator.1
MARKETS: Lift Off – Building on First Quarter Gains
Positioned and poised for the possibility of another difficult year, investors were not anticipating the record market strength that punctuated the midpoint of the year. The S&P 500 ushered in a new bull market, advancing more than 20.0% from its October 2022 low and now sitting just 7.0% off its record high. Up 16.9% year to date, the S&P 500 gained 8.8% in the second quarter with a 6.5% return in June alone.
The NASDAQ eclipsed those stellar returns, with its strongest start to a year in four decades, climbing 32.3% year to date, 13.1% in the second quarter and 6.6% in June, but still sits 14.0% below its all-time high. The DJIA advance was more muted, returning 4.0% in the second quarter and 4.9% year to date, yet only 6.5% off its January record close.
Market strength could be ascribed to a list of once headwinds turning into favorable tailwinds: a debt ceiling resolution, easing regional bank stress, durable disinflation trends, renewed indications of a soft landing, better than feared quarterly corporate earnings and a spectacular mega-cap technology rally.
Entering the second quarter, mega-cap technology stocks had already led the market to start the year, enjoying favorable valuations and being rewarded for the adoption of cost-cutting/efficiency measures to ensure ongoing profitability. But they catapulted higher with the explosion of investor interest in AI (Artificial Intelligence). AI attracted investors intrigued by the long-term prospects of these technologies improving the efficiency, productivity and profitability of any company.
As a result, investors piled into companies with first-mover advantage in the AI ecosystem; Nvidia, Microsoft and Alphabet soared. Additional mega-cap tech darlings enjoyed a remarkable second quarter: Apple rocketed to an all-time high, becoming the first company to have over a $3.0 trillion market cap and Tesla enjoyed a historic run up over 28.0% in June alone and 127.0% year to date.
Nicknamed the “Magnificent 7”, Apple, Microsoft, Nvidia, Amazon, Meta, Tesla and Alphabet accounted for more than half of the S&P 500’s YTD returns. In the second quarter, NVDA returned 52.3%, META 35.4%, TSLA 26.1%, AMZN 26.1%, MSFT 18.1%, AAPL 17.6% and GOOGL 15.4% – all building on their first quarter gains.2
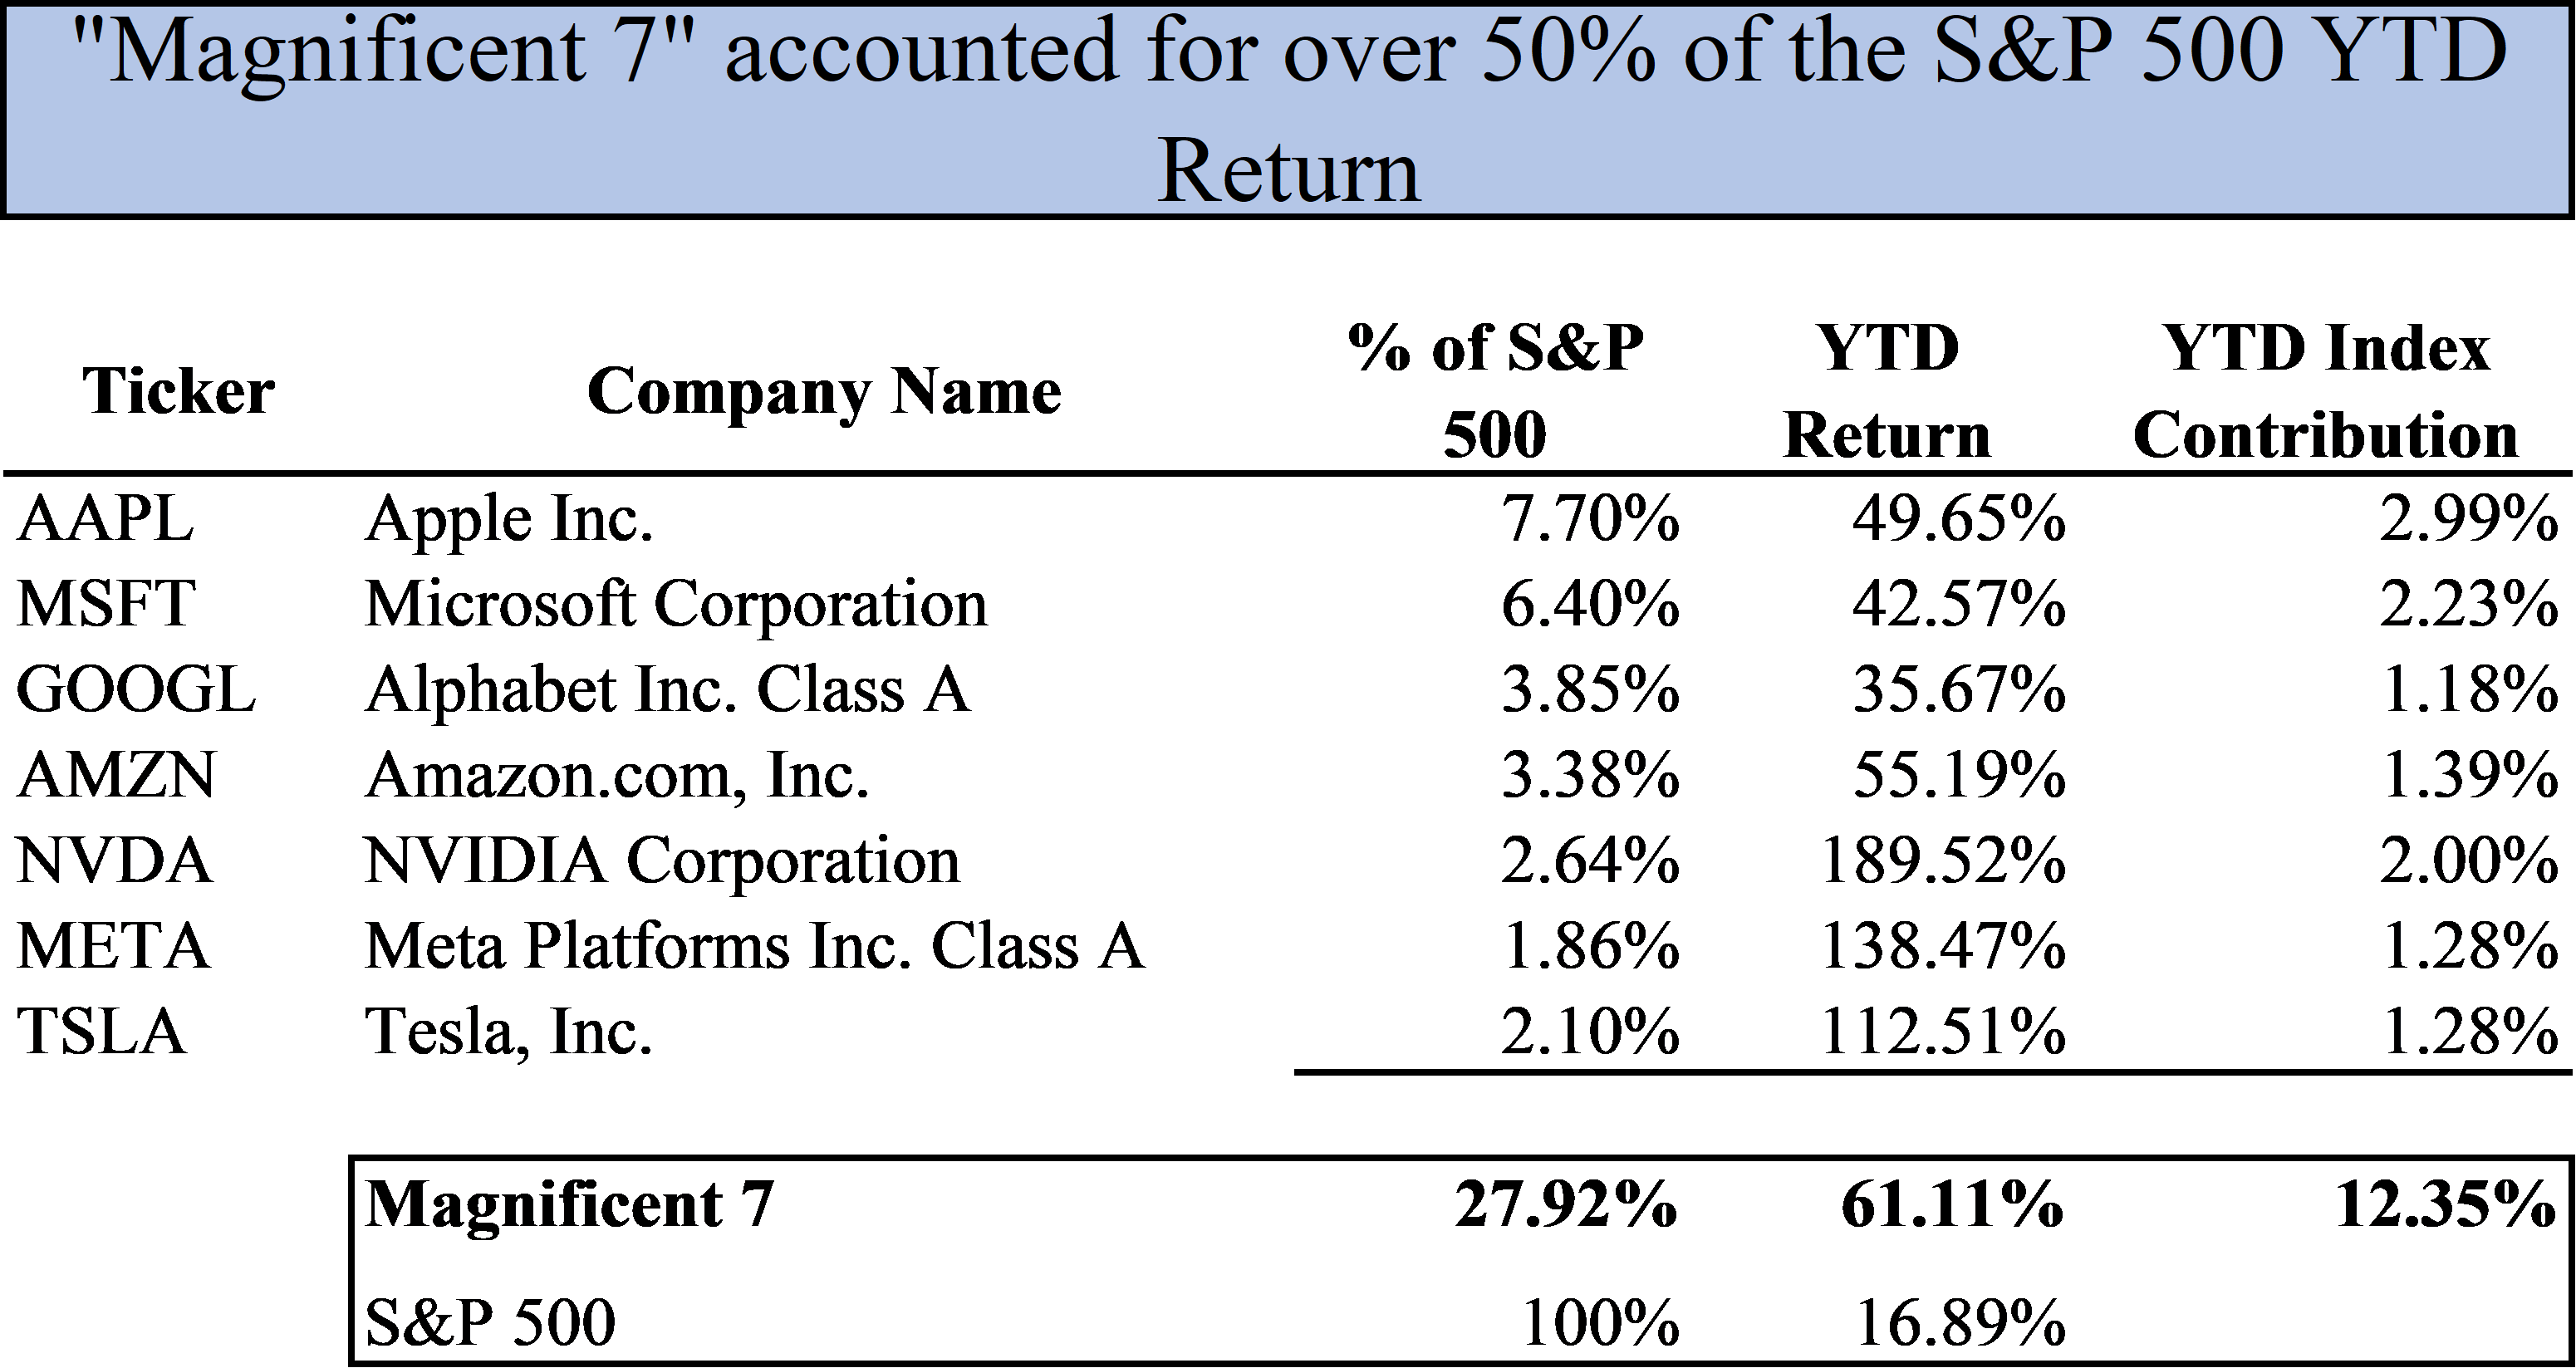
Outside of this narrow band of companies, returns for stocks were significantly lower with the average S&P 500 stock only advancing 6.0% YTD.3 This limited market leadership caused some investors to question the durability of the market’s advance; questioning if this was an “unhealthy” rally and wondering how could the market continue to move higher on the back of only a handful of sector specific stocks already at premium valuations? By quarter end, market breadth had improved and investors were comforted by companies in different sectors, styles and sizes all moving higher. Small and mid-cap indices outperformed the large cap S&P 500 in June with the small cap Russell 2000 advancing for the first time since January. Cyclical sectors such as industrials and materials enjoyed double digits and outpaced technology stocks for the month.

FIXED INCOME: Yield Curve Inversion Deepens
In the second quarter, fixed income volatility increased in the wake of rising rates, banking sector instability and fears of a government default. These pressures resulted in a spike in short term rates exacerbating the inversion of the yield curve.
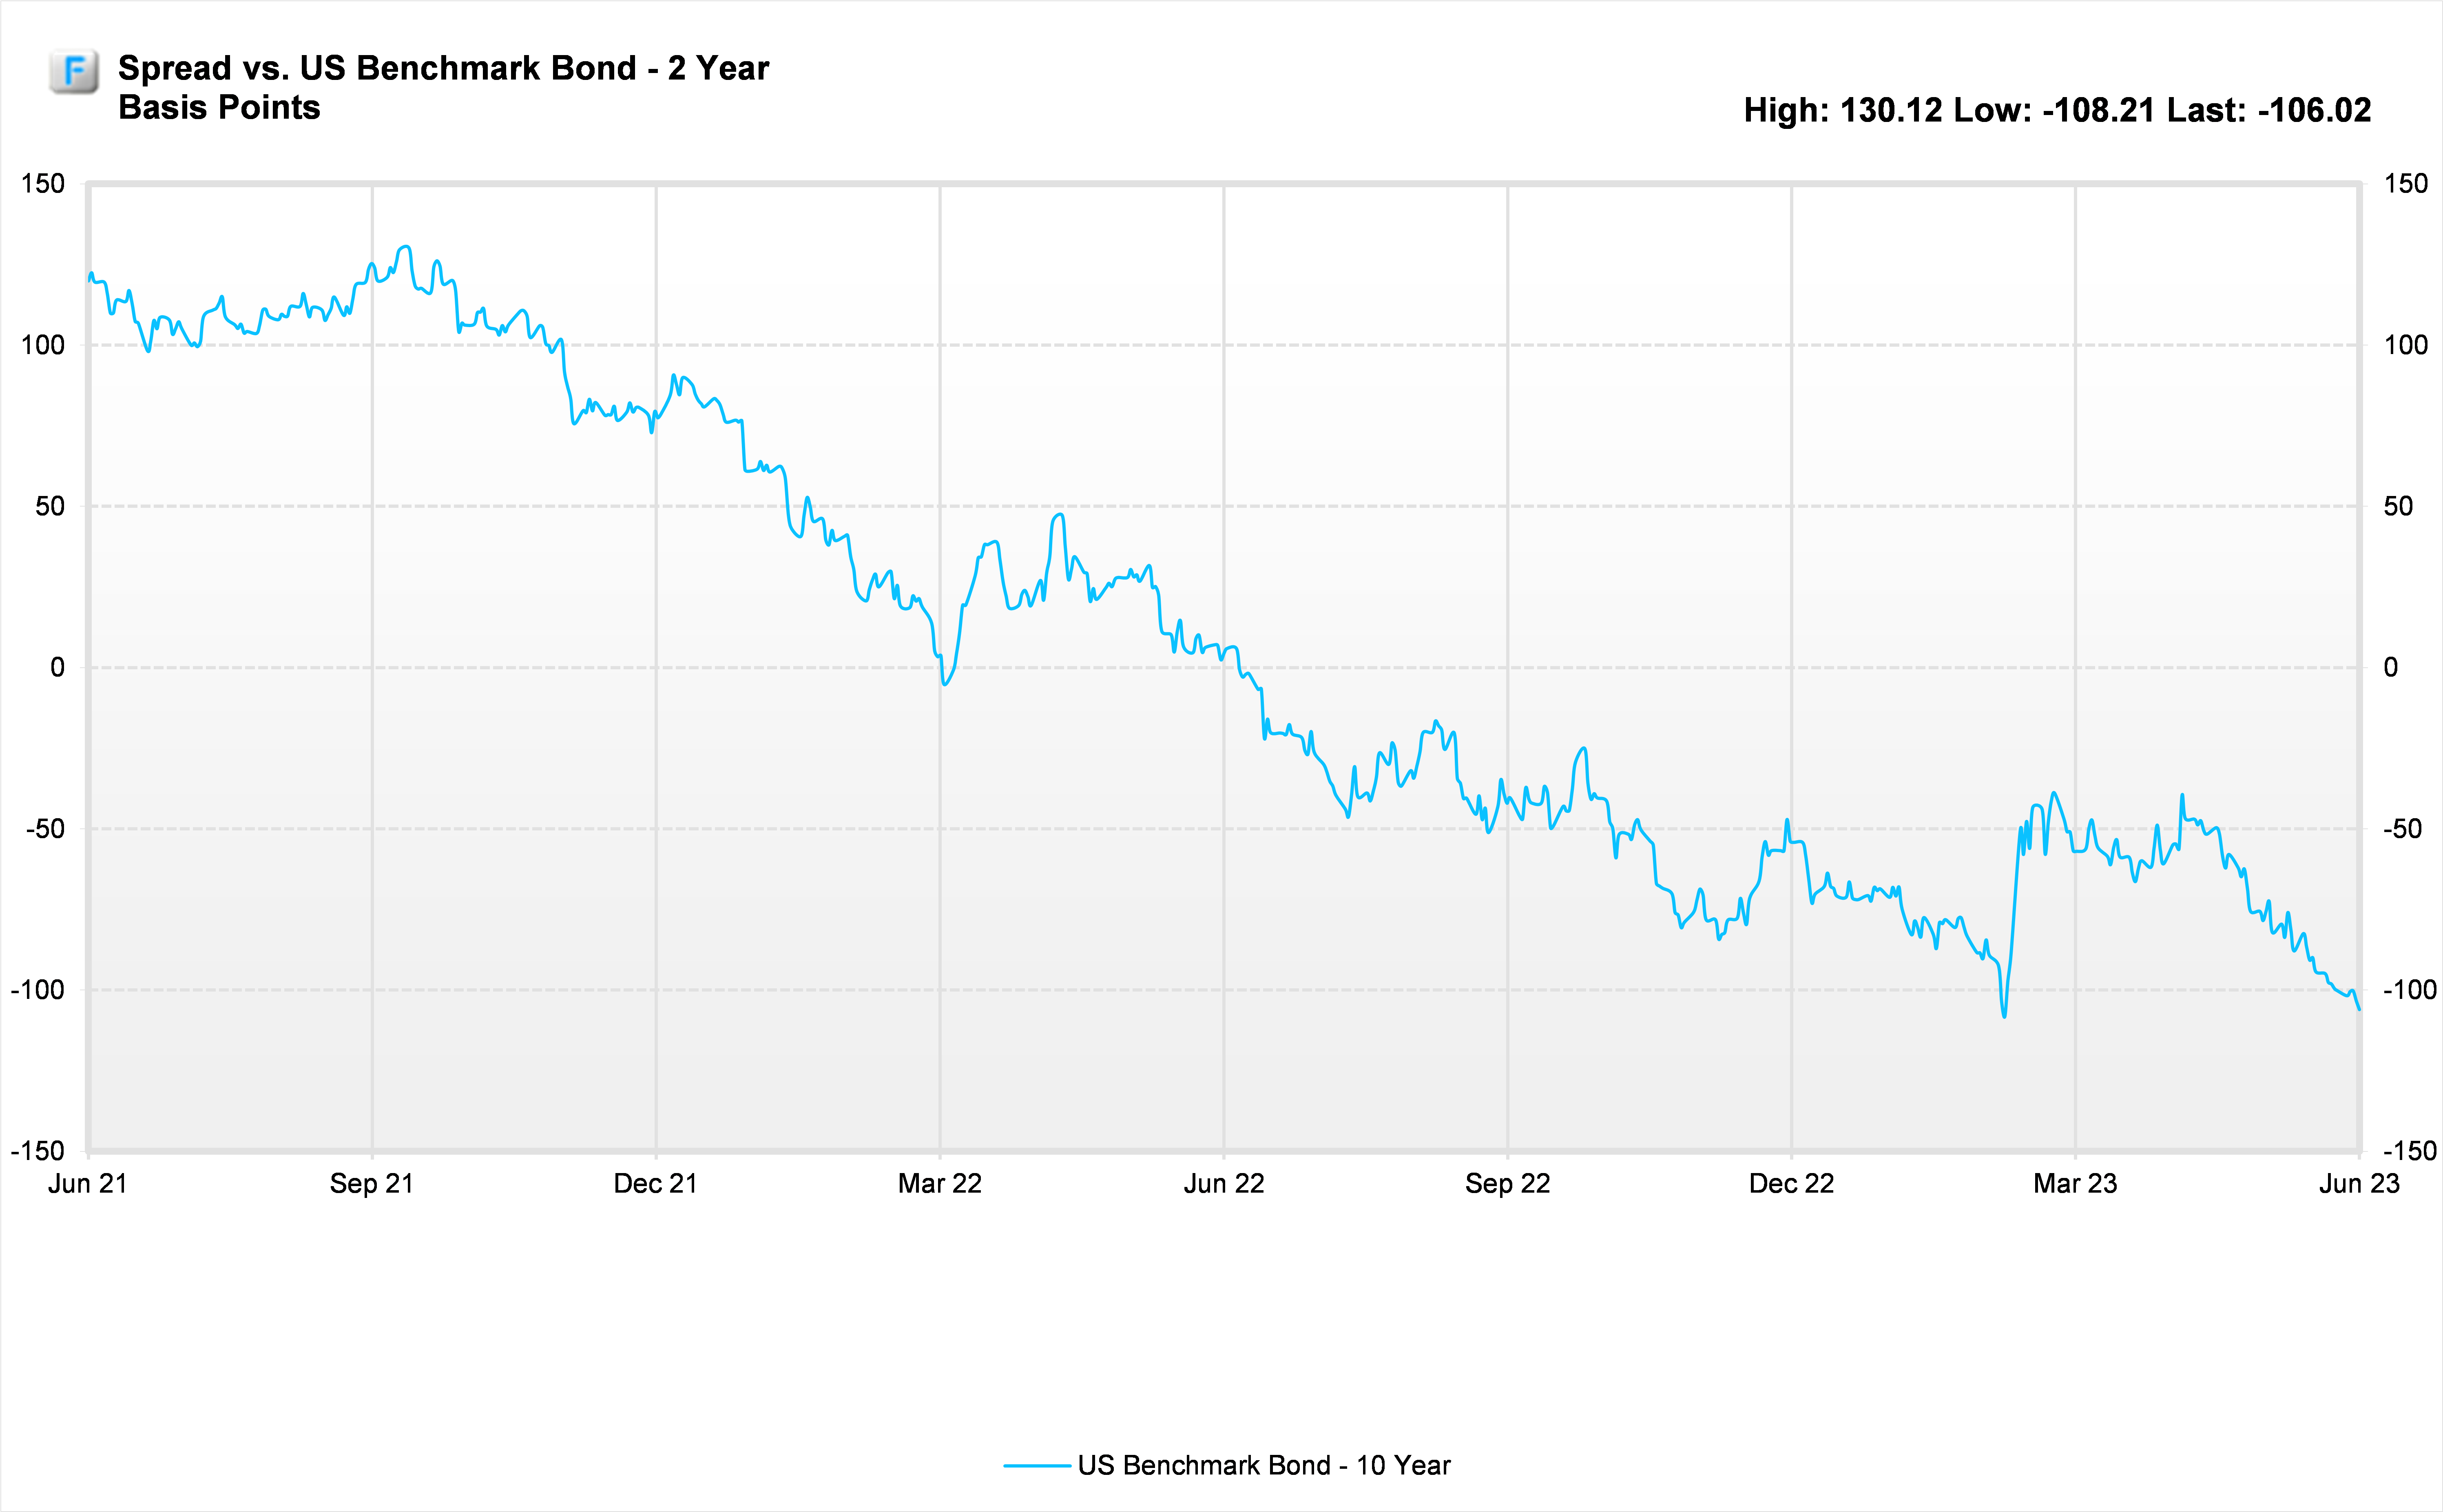
With 2-year treasury yields jumping 80 basis points to 4.9% and 10-year treasury yields rising 31 basis points to 3.8%,4 the magnitude of the yield curve inversion now nears its peak of -108 basis point in early March, occurring after the failure of Silicon Valley Bank. Recent spikes on the short end reflect the Fed’s commitment to hold rates higher for longer to further cool inflation with the deepening inversion refocusing investors on the dichotomy between the bond market’s hard landing message in opposition to the soft-landing message from the equity markets.
It is important to note that while the yield curve has remained inverted for almost a year with still no recession in sight, neither the magnitude nor length of inversions has had any correlation to the duration and magnitude of any subsequent recession.
INFLATION: Still Too Hot – More Work to Do
Headline Consumer Price Index (CPI) fell in May to 4.0%, as disinflation in food and outright deflation in energy prices brought levels to their lowest point in two years. In aggregate, however, inflation remains too high and too hot. As a result, the Fed remains focused on core readings that not only remain elevated but continue to grow at a faster pace than headline CPI.
The Fed’s preferred inflation gauge, the Core Personal Consumption Expenditures (PCE) inflation reading, while lower than expected in May, has been pegged at 4.6% over the last several months and remains well above the Fed’s 2.0% inflation target. This is a key reason behind the 75 basis points of hikes in the second quarter and the hawkish Fed position today.
While goods inflation has softened, services inflation, which is particularly sensitive to labor costs, has remained persistent. Wages are a key focus for the Fed, and while wage growth has declined from its 6.0% peak to 4.5%, it remains above the 2.5-3.5% levels generally assumed to be commensurate with stable inflation.
In order to evaluate trends in these areas, the Fed favors a narrower slice of PCE – super-core inflation – which excludes housing, food and energy. This ultra-focused measure concentrates on the 50% of core PCE that has been tough to bring down and provides a window into the impact of rising wages on prices. While slowing in May to 4.5%, the super-core measure remains elevated on a year-over-year basis.
In the words of Fed Chair Jerome Powell, “Inflation pressures continue to run high, and the process of getting inflation back down to 2.0% has a long way to go.” There is still more work to be done.
FED SURPRISE: PAUSE, HIKE, HOLD – Higher for Longer
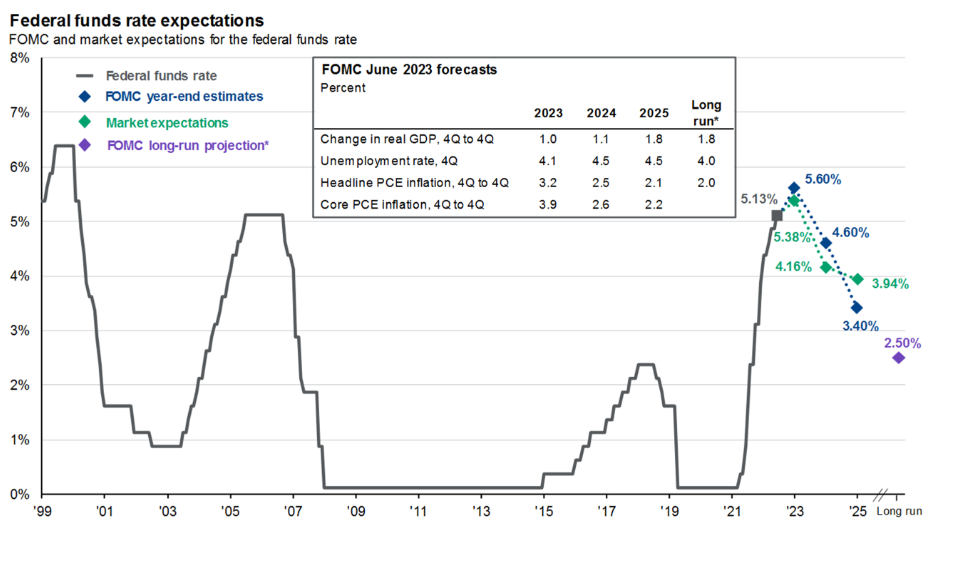
The Fed’s hawkish pause at their June 14 meeting came with a twist. While the “no hike” decision was widely anticipated, the Fed surprised the market with its dot-plot, updated summary of economic projection and press conference, indicating that two more rate hikes are in play in 2023, with some Fed officials advocating even further rate hikes this year if conditions warrant them.
That message repriced the terminal rate, the rate where the Fed intends to stop hiking, to 5.6% from March’s projection of 5.1%. Also of interest in the June Summary of Economic Projections (SEP), was the less dire outcome for the economy. As compared to March, the Fed adjusted its GDP projections higher and unemployment rate expectations lower, but increased its core inflation projections higher, indicating a softer landing but also stickier inflation excluding food and energy requiring further restrictive action on the part of the Fed.
When looking at the Fed Funds Futures market, it appears that bond market participants have finally conceded and removed any 2023 rate cuts from their expectations. At the end of March, the market was pricing in upwards of 0.75% of rate cuts in 2023, thinking that monetary policy would create a severe downturn requiring Fed intervention. The market has given up on the idea of rate cuts this year, however the bond market is not entirely on board with the Fed’s “higher for longer” mantra, pricing in cuts well before the Fed.
Source: Bloomberg, FactSet, Federal Reserve, J.P. Morgan Asset Management.
Where Do We Go from Here - More Gains Ahead?
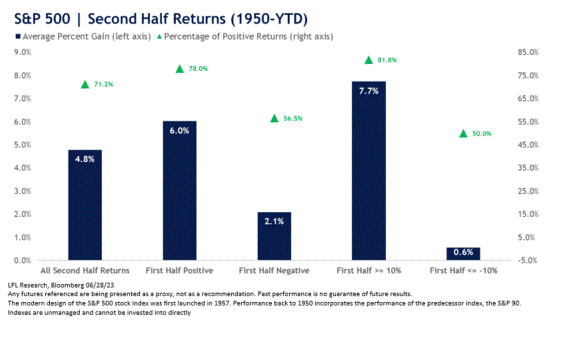
If we use history as a guide, the case can be made that the strong performance in the first half bodes well for the second half of the year. According to the chart below, since 1950, the S&P 500 has followed up a positive first half with an average second half gain of 6.0%. Furthermore, when first half gains were 10% or higher, the index posted average gains of 7.7% in the second half, with 82.0% of occurrences producing positive results.
While presented with a favorable historical backdrop, the market’s advance will continue to be tested by incoming inflation and employment data, the July Federal Reserve meeting and the upcoming earnings season. A pullback or correction as the market digests any of these reports would not be surprising as we move through the third quarter. We continue to rely on asset allocation and diversification to safeguard portfolios during volatile markets and welcome the opportunities that pullbacks present us.
We value your continued faith in Cape Cod 5 as your trusted financial advisor and encourage you to contact your investment professional if you have questions about how this information impacts your specific portfolio.
1 Ryan Nunn, Jana Parsons, Jay Shambaugh, "How will we know when a recession is coming?", Brookings, last modified May 18, 2020, https://www.brookings.edu/articles/how-will-we-know-when-a-recession-is-coming.
2 FactSet
3 Nicholas Jasinski, "Stock Market Rallies Because Good News is Good News. But It's Still a Time to Be Cautious.", Barron's, last modified July 3, 2023, https://www.barrons.com/articles/stock-market-rallies-because-good-news-is-good-news-why-its-time-to-prepare-for-the-worst-c7efaaf5?st=mrhcrv3iqzqfbsp.
4 FactSet
Rachael Aiken
Senior Investment Officer
On behalf of the Cape Cod 5 Trust and Asset Management Investment Team
Michael S. Kiceluk, CFA®, Chief Investment Officer
Brad C. Francis, CFA®, Director of Research
Rachael Aiken, CFP®, Senior Investment Officer
Jonathan J. Kelly, CFP®, CPA, Senior Investment Officer
Benjamin M. Wigren, Senior Investment Officer
Kimberly K. Williams, Senior Wealth Management Officer
Robert D. Umbro, Senior Investment Officer
Craig J. Oliveira, Investment Officer
Jack Dailey, Investment Analyst
Alecia N. Wright, Investment Analyst
These facts and opinions are provided by the Cape Cod 5 Trust and Asset Management Department. The information presented has been compiled from sources believed to be reliable and accurate, but we do not warrant its accuracy or completeness and will not be liable for any loss or damage caused by reliance thereon. Investments are NOT A DEPOSIT, NOT FDIC INSURED, NOT INSURED BY ANY FEDERAL GOVERNMENT AGENCY, NOT GUARANTEED BY THE FINANCIAL INSTITUTION AND MAY GO DOWN IN VALUE.
Read recent Market Reviews
Contact our Wealth Team More Market Insights from Cape Cod 5
