Market Review Q1 2019 | Market Review Q2 2019 | Market Review Q3 2019 | Market Review Q4 2019
Market Review Q1 2020 | Market Review Q2 2020 | Market Review Q3 2020
Market Review - Fourth Quarter 2020
The 2020 stage was set; the script was a work in progress. The opening scene was ominous with the appearance of the main character, an antagonist being a once-in-a-century pandemic. Act One delivered a bear market, erasing trillions in market value in just a few short weeks. The plot thickened with an economic shutdown and 20% unemployment hitting the most vulnerable workers hardest.
Heroes reveal themselves in surprising ways and 2020 was no exception - frontline workers, scientists and health experts, central banks, social and corporate leaders, owners of small businesses, and, yes, even politicians. Action was swift. Four pandemic relief bills passed within weeks totaling $2.8 trillion. Monetary and fiscal policy makers combined to deliver more stimulus than during the Great Financial Crisis in a fraction of the time. When shelter-in-place mandates were announced, corporations quickly pivoted, transitioning large portions of the nation’s workforce to work-from-home almost overnight. The nation demonstrated their right to a say in the country’s future. Voter turnout exceeded 2016 turnout in 98% of the 3,142 counties in the U.S.
As the curtain closes on 2020, the dizzying plot gave us many storylines of which we can be proud. Our society and economy are resilient. The economy is growing again, unemployment is dropping, and multiple vaccines are becoming available. A new Act is emerging - brighter and more promising.
Economy
In mid-December, the Federal Open Market Committee (FOMC) held its final meeting of 2020, maintaining the Federal Funds target rate in a range of 0.00%–0.25%. The Committee pledged to continue monthly net purchases of at least $80 billion in U.S. Treasuries and $40 billion in agency mortgage-backed securities. Purchases will continue until the Committee feels “substantial further progress” has been made toward its inflation and employment goals. The Committee also revised growth forecasts higher for 2020-2022, suggesting a stronger recovery than previously anticipated.
The third estimate by the Department of Commerce for Q3 GDP growth was 33.4%, in-line with consensus and previous estimates. The quarter over quarter change was an astonishing 64.8% (from -31.4% to +33.4%).
Nearly all economists are anticipating a sharp improvement in the economy in 2021. According to the International Monetary Fund (IMF) World Economic Outlook, global GDP growth is expected to grow 5.2% in 2021 after an estimated 4.4% decline in 2020. Growth will come from substantial inventory rebuilding, a revival in travel, accelerating consumer spending and large government spending programs.
Fiscal and monetary support has had a significant impact on mitigating the effects of the pandemic on the economy. The Congressional Budget Office (CBO) estimates that the CARES Act helped offset an expected 10% decline in real GDP by 4.7% in 2020 and could provide a 3.1% boost to growth in 2021. The Committee for a Responsible Federal Budget, an independent nonpartisan group, estimates the passage of the most recent $900 billion stimulus bill could add another 3% to GDP in 2021.
U.S. debt as a percent of GDP topped 120%, the highest level since World War II. The U.S. Federal government ended the year owing $27.6 trillion, up 16% from year-end 2019. The two largest holders of U.S. public debt are Japan (5%) and China (4%).
Existing home sales fell by 2.5% in November, according to the National Association of Realtors, to a seasonally adjusted annual rate of 6.69 million. Total housing inventory was down 9.9%. Limited inventory was cited as one reason for the drop in sales. On a year-over-year basis, existing home sales were up 25.8%. The median existing home price was $310,800, up 14.6% from last year. Of note, national average home prices increased year-over-year for the last 105 months in a row.
The nation will face more debt and wider deficits. With rock bottom interest rates, the issue is not an immediate threat, but it could limit the government’s ability to respond to emergencies or tackle large long-term problems like infrastructure modernization.
Equities
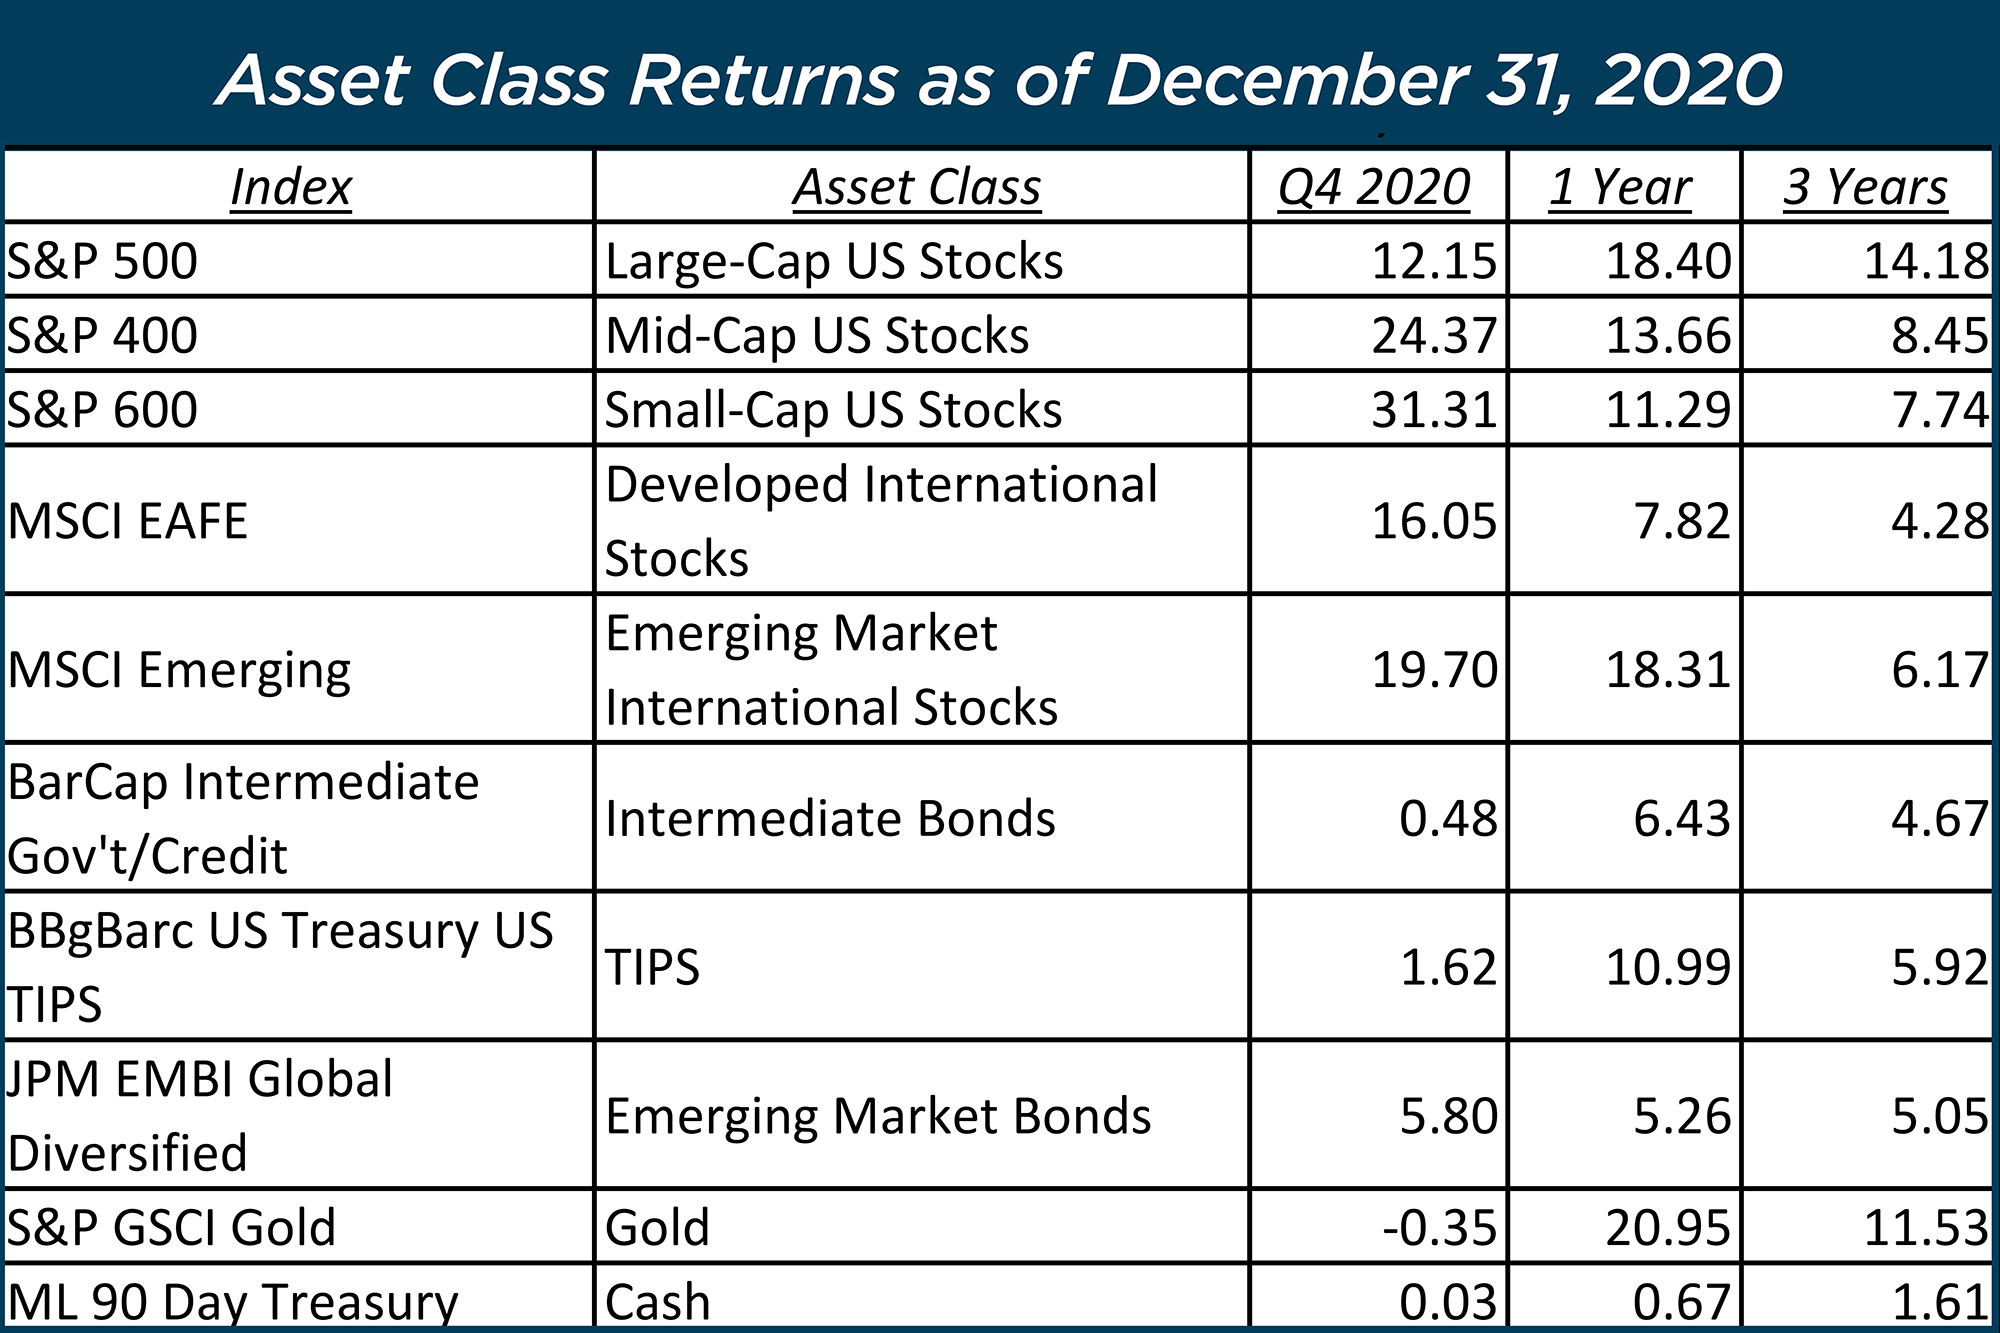
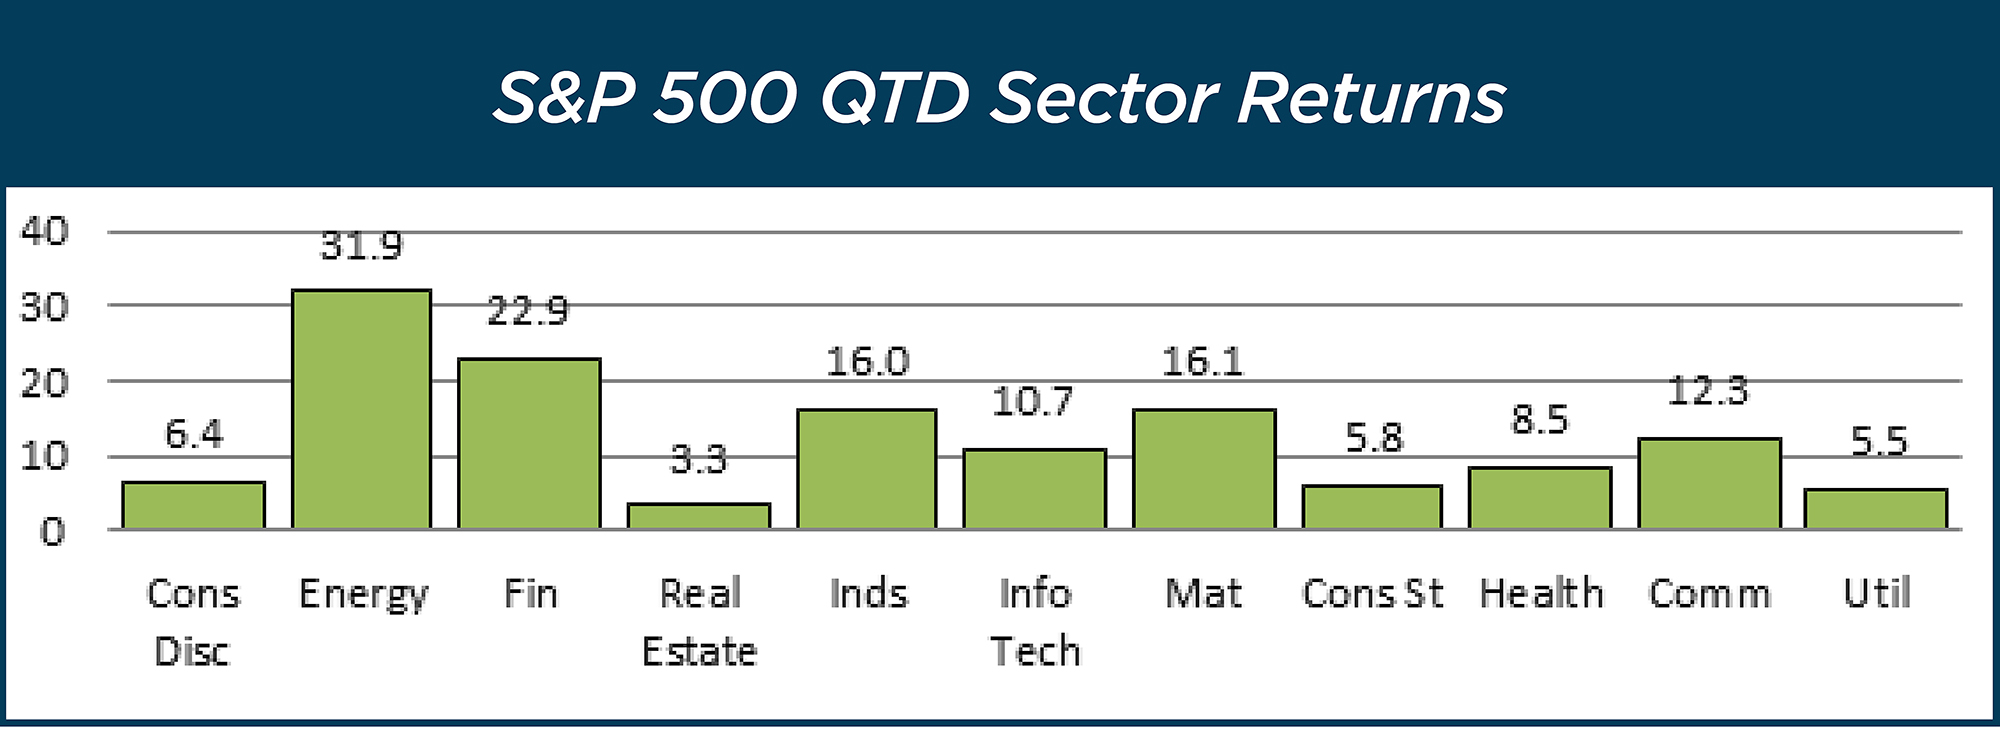
The fourth quarter was another good one for stocks, with the S&P rising 12.15%. A good sign in the quarter was the significant rotation in leadership. The large gap between the best performing sectors and worst performing sectors narrowed as Energy, Industrials and Financials – laggards in the first three quarters – rallied. The first two jumped on the perception that the Biden administration will loosen trade restrictions and spend more on infrastructure, while Financials got a boost on the premise of rising rates and improved net interest margins.
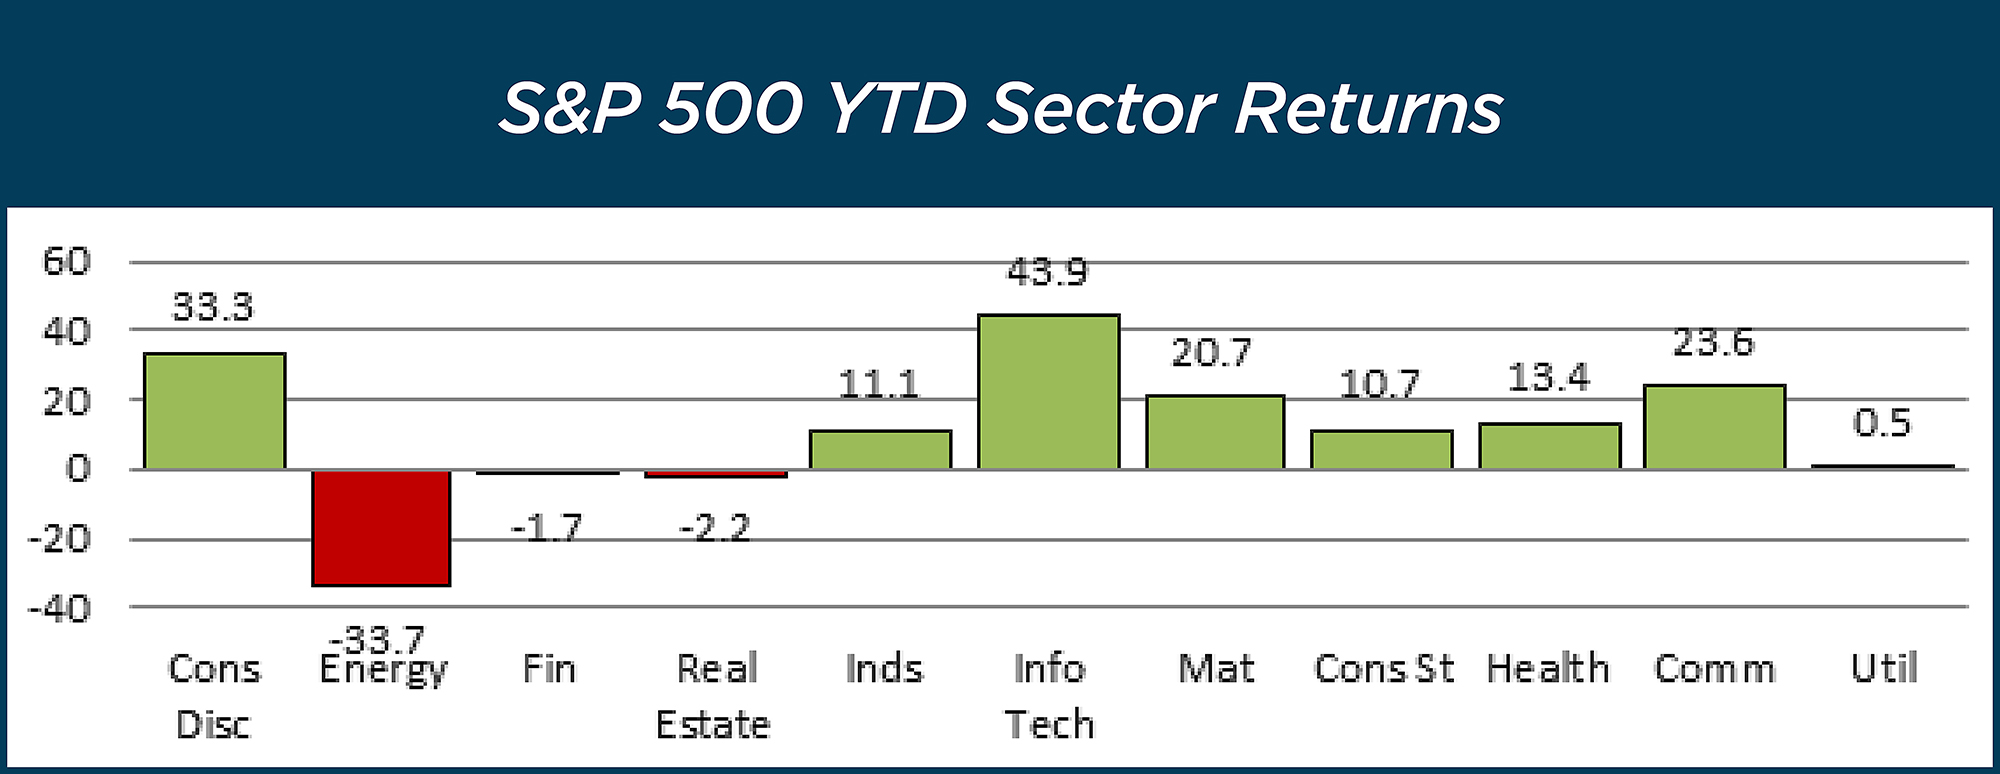
Energy and Financials, two of the three best performers in the quarter are two of the three worst performers YTD.
Other long-term trends also reversed in the fourth quarter as value stocks gained ground on growth stocks and mid and small cap stocks bested large-cap. Full-year leadership remains firmly in the hands of Technology, Communication Services and Consumer Discretionary.
Consistency was not the buzzword for stocks in 2020. The S&P 500 posted at least a 1% gain on 27% of the trading days in 2020, (the best percentage for a calendar year since 1938). The index also posted losses in excess of 1% on 20% of the trading days – the most since the Great Financial Crisis. Almost half the trading days had gains or losses of at least 1%.
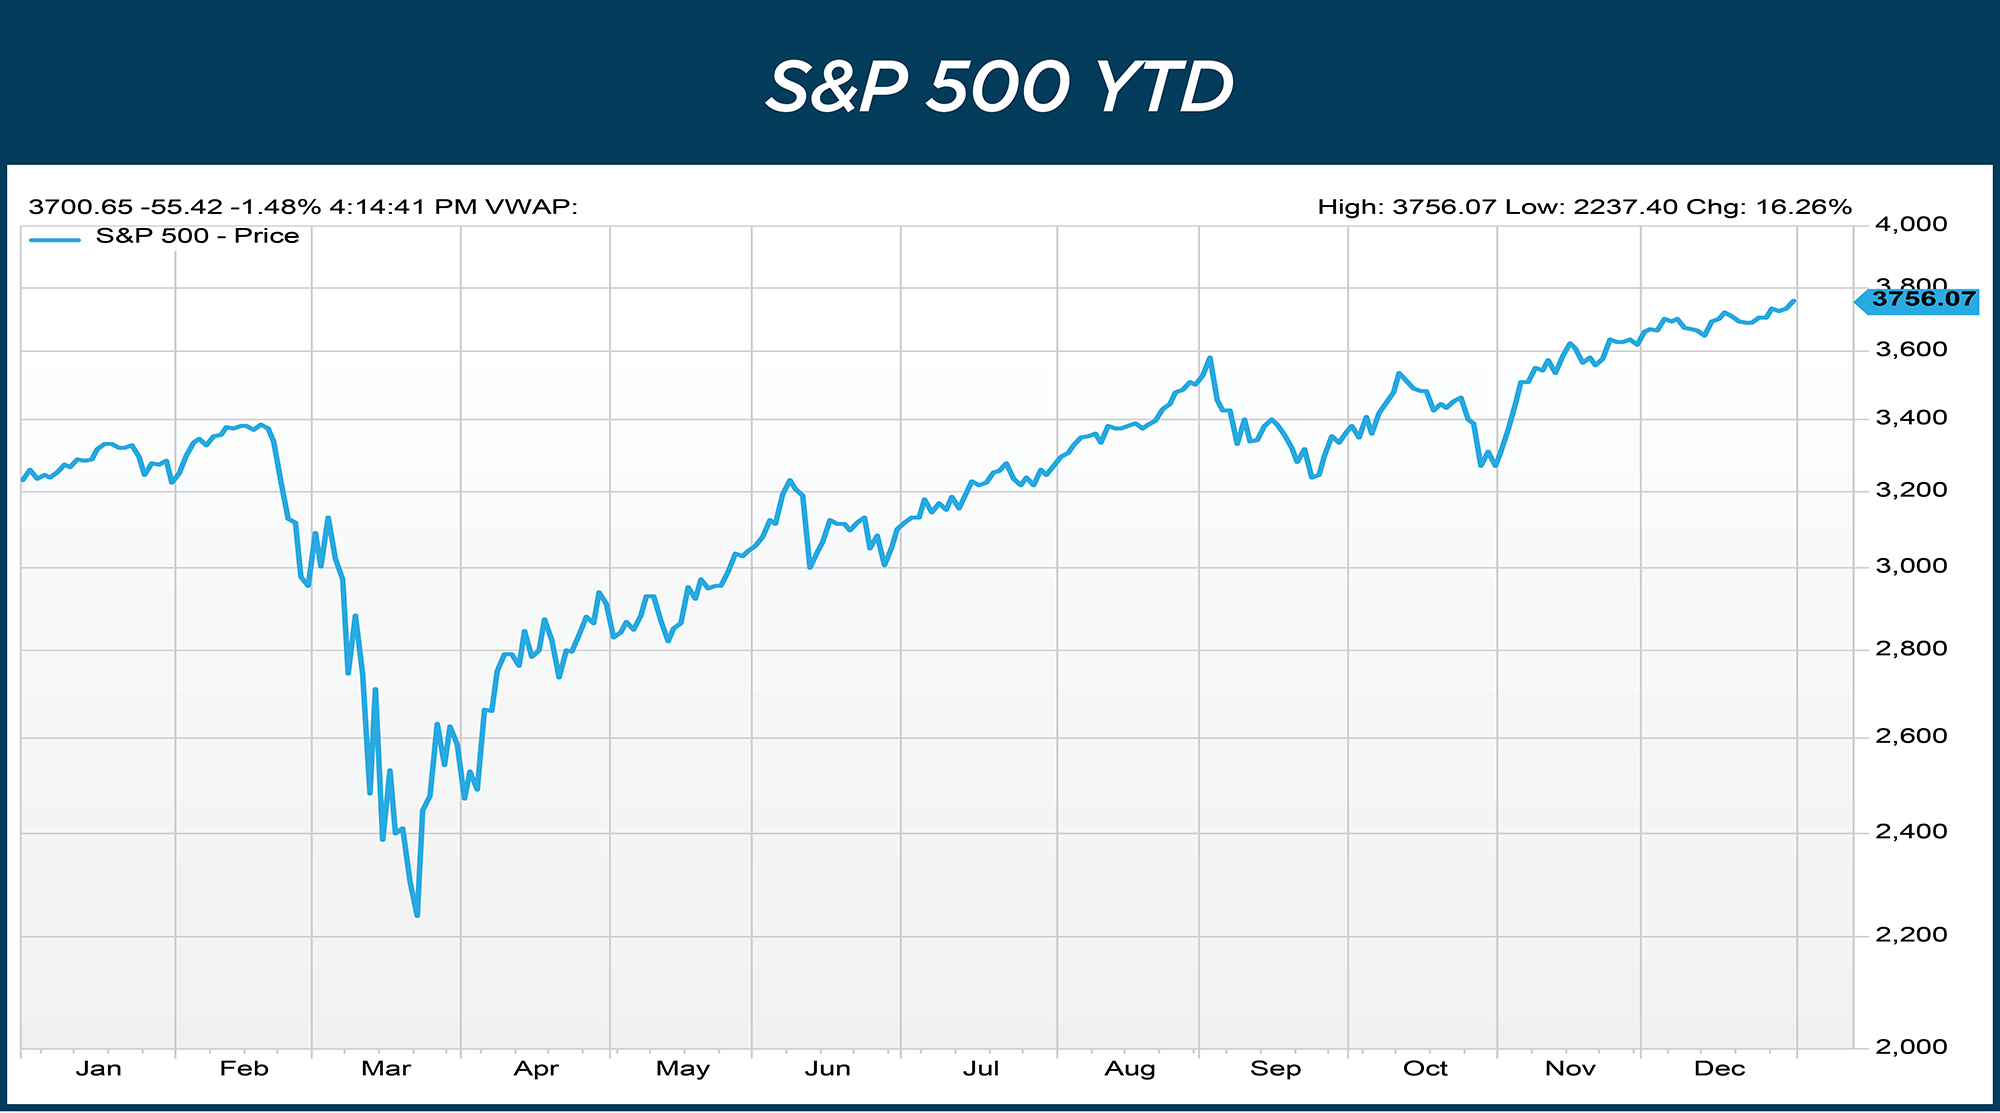
The V shape market recovery masks a year of daily volatility.
Obstacles to the market’s continued advance include stretched equity valuations, worsening coronavirus trends and deteriorating sentiment. Likely not enough to keep equity markets down for long unless the economic recovery does not materialize as expected.
Fixed Income
While equity markets tend to grab the headlines, fixed income markets experienced their fair share of tumult during the year. The 10-year U.S. Treasury bond started the year at 1.92% and ended the year at .93%. In early March, the 10-year closed at .50%, the lowest level since these bonds began trading in 1790! Concerns about an inverted yield curve disappeared almost overnight as short-term rates dropped dramatically.
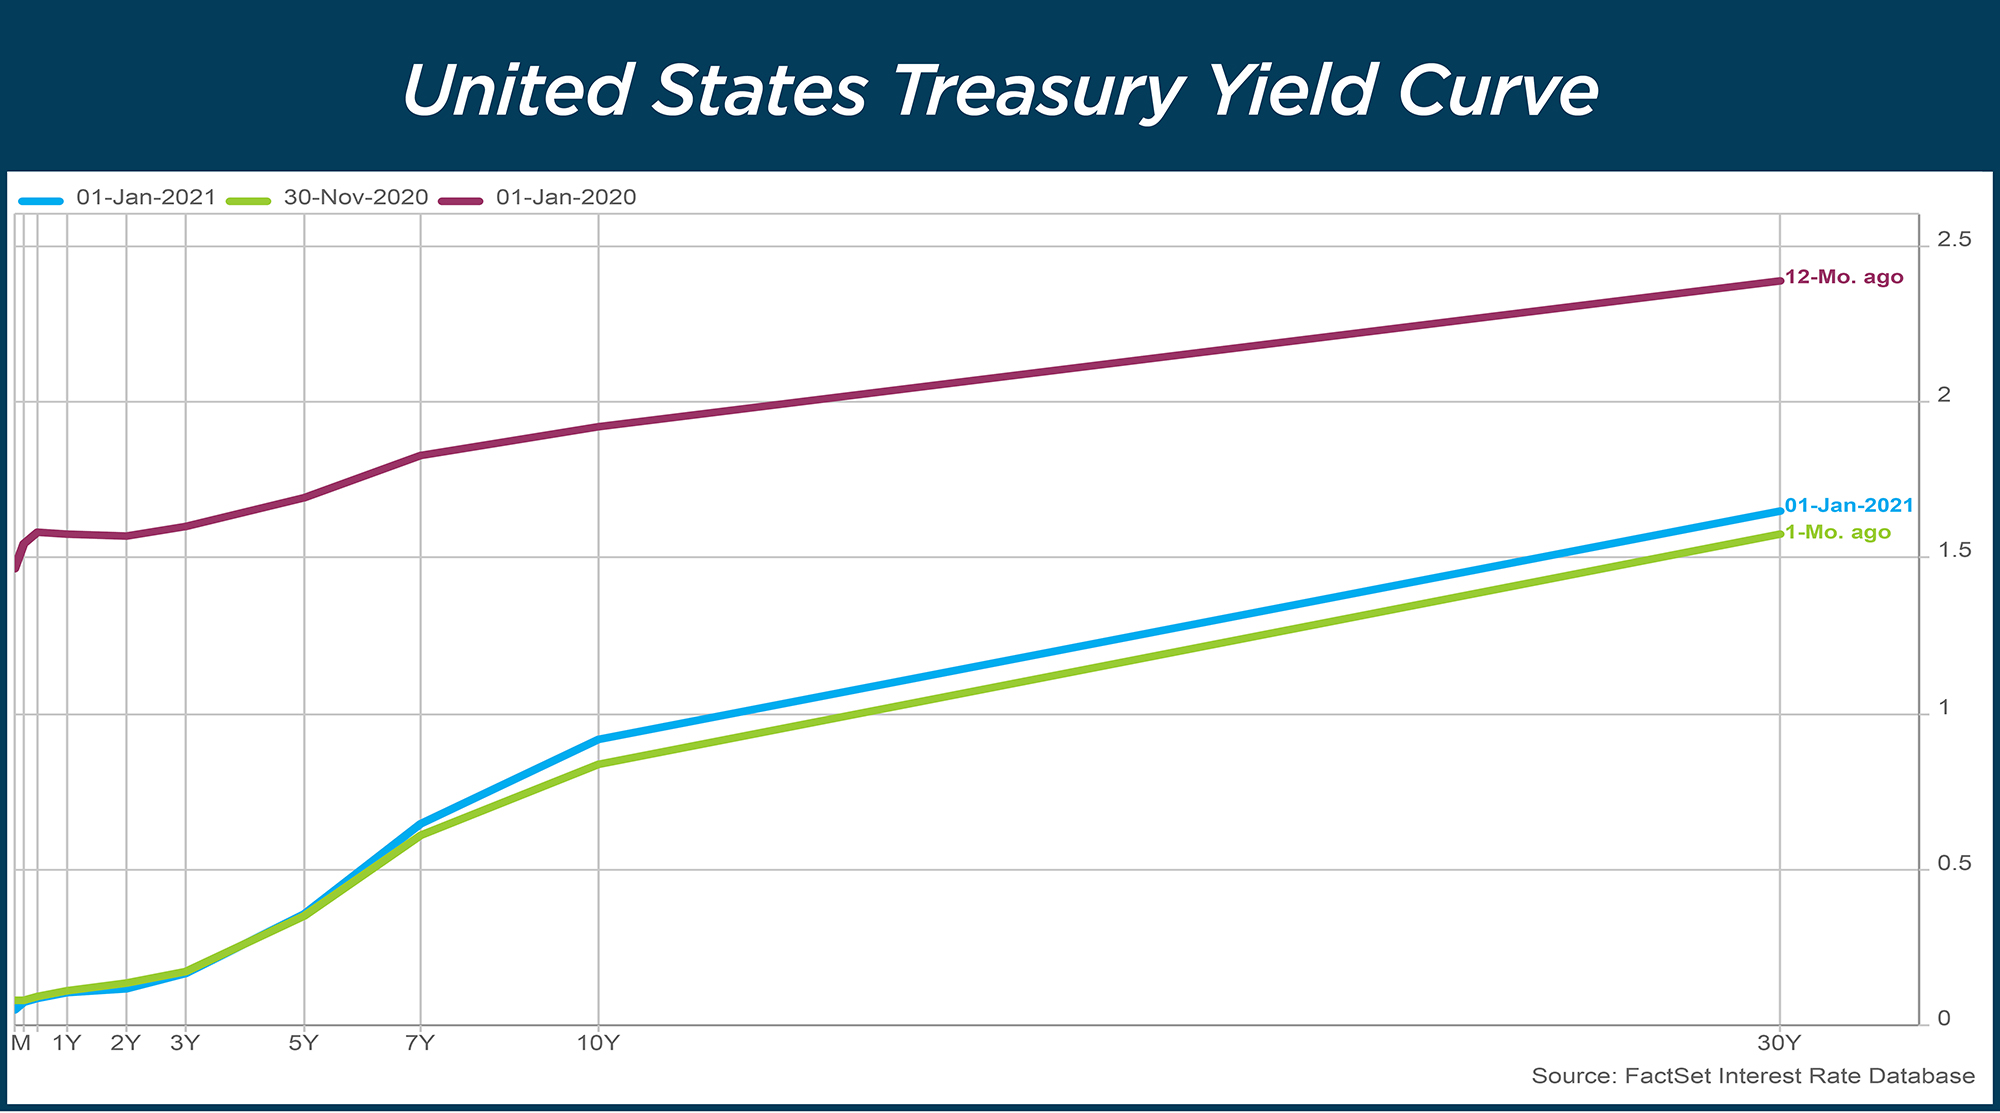
The yield curve started the year much flatter (red line) than where it ended (blue line). Good news for investors concerned about “curve inversion”.
Navigating an increasingly difficult fixed income environment will continue to be a challenge. Historically, fixed income provided capital preservation, income and diversification. With rates at rock bottom levels, income has all but disappeared. The 10-year U.S. Treasury currently offers negative real yields. Buying a bond today ensures 10 years from now your money will buy fewer goods than it does today – not a great selling point. Yet demand remains insatiable in large part due to even lower yields outside the U.S. There are no easy solutions, only tradeoffs. Owning a variety of fixed income assets can help. It is one reason we added emerging market debt and inflation protected bonds into client portfolios in 2020. Managing duration, or interest rate sensitivity, will be another important consideration. As the economy recovers, rates could move higher. Sacrificing a little yield today should provide some protections against loss in market value if rates rise.
Advisor Value
As advisors, we often neglect to share behind-the-scenes work conducted on behalf of our clients in an effort to enhance value. We would like to take a moment to highlight a few that happened in 2020:
1. Tax Loss Harvesting
The March selloff presented an opportunity to build tax assets and reduce realized gains in taxable accounts. To take advantage of the opportunity, we increased trading by over 50% in 2020 without materially altering portfolios. This significant effort saved tens of thousands in tax obligations for clients.
2. Trading Costs
More trading increases costs, which are typically passed through to the client. At Cape Cod 5 we absorb those costs, saving clients over $125,000 in 2020.
3. CARES Act and RMD Management
The CARES Act offered unique planning opportunities. Those subject to required minimum distributions (RMD) could elect to repay or waive their distribution. We spoke with more than 200 clients, or their tax preparers, and facilitated more than 70 repayments and/or suspensions, reducing taxable income by tens of thousands.
4. Portfolio Manager Fees
We like focusing on things we can control, one of which is expenses - an important criteria for the investment team when selecting an outside manager to complement the work we do internally. One such manager is in our high yield fixed income area. High yield bonds are not an investment we would suggest holding individually, but can be a great addition in moderation and as part of a larger strategy. In 2020 we switched investment vehicles, retaining the same manager and portfolio characteristic. The change reduced the overall expense ratio by 24 basis points (bps) or .24%, saving clients more than $35,000 annually.
5. Ground-Up Portfolio Construction and Optimization
Business cycles begin and end. Markets evolve. We constantly look for opportunities that could improve outcomes. After hundreds of hours of research and analysis, the investment team added several asset classes to client portfolios in 2020.
Final Thoughts
Market participants seem increasingly comfortable with a Biden administration and reconstituted Congress. Janet Yellen, who has been nominated for US Treasury Secretary, and Federal Reserve Chairman Jay Powell present a powerful combination that should instill investor confidence.
This recovery will be different. The evolution in corporate and consumer behaviors that matured during the pandemic may not revert or disappear with widespread vaccination. A “recov-olution”, as some have described it, could be the foundation for the next economic cycle.
Prognosticating about the future is always a difficult endeavor. In Barron’s 2020 outlook, all ten expert strategists interviewed for their 2020 predictions under-estimated returns for the S&P 500 and over-estimated yields for the 10-year Treasury. We can do at least as well. More importantly, we will be here to guide and administer with prudence, loyalty and care.
Wishing you a safe, healthy and happy new year.
Michael S. Kiceluk, CFA, Chief Investment Officer
Brad C. Francis, CFA, Director of Research
Lee C. Gatewood, Senior Investment Officer
Jonathan J. Kelly, CFP®, CPA, Senior Investment Officer
Sean F. McLoughlin, CFP®,CIMA, Senior Investment Officer
Robert D. Umbro, Senior Investment Officer
Kimberly K. Williams, Senior Wealth Management Officer
Craig J. Oliveira, Investment Officer
Christopher E. Chen, CFA, Investment Analyst
These facts and opinions are provided by the Cape Cod Five Trust and Asset Management Department. The information presented has been compiled from sources believed to be reliable and accurate, but we do not warrant its accuracy or completeness and will not be liable for any loss or damage caused by reliance thereon. Investments are NOT A DEPOSIT, NOT FDIC INSURED, NOT INSURED BY ANY FEDERAL GOVERNMENT AGENCY, NOT GUARANTEED BY THE FINANCIAL INSTITUTION AND MAY GO DOWN IN VALUE.
Contact our Wealth Team More Market Insights from Cape Cod 5
